Retail Space
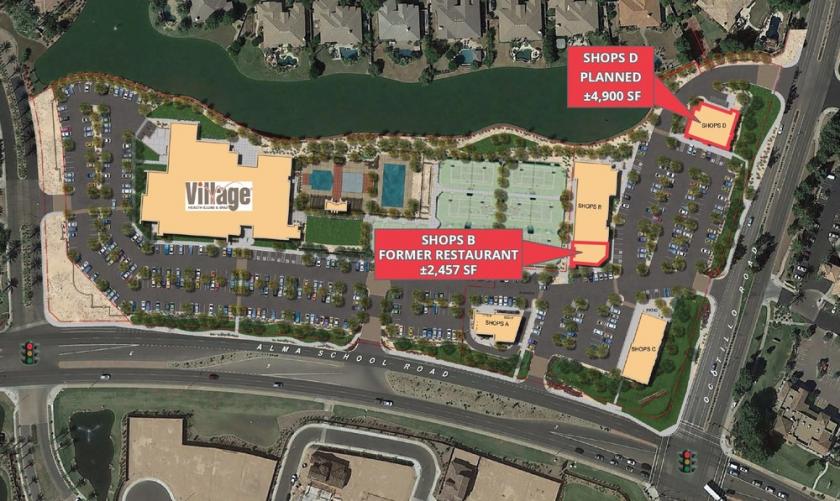
1155 West Ocotillo Road Chandler, AZ 85248
1155 West Ocotillo Road Chandler, AZ 85248
Details & Description
Property Highlights
- • Close proximity to I-10 Freeway and the Loop 202
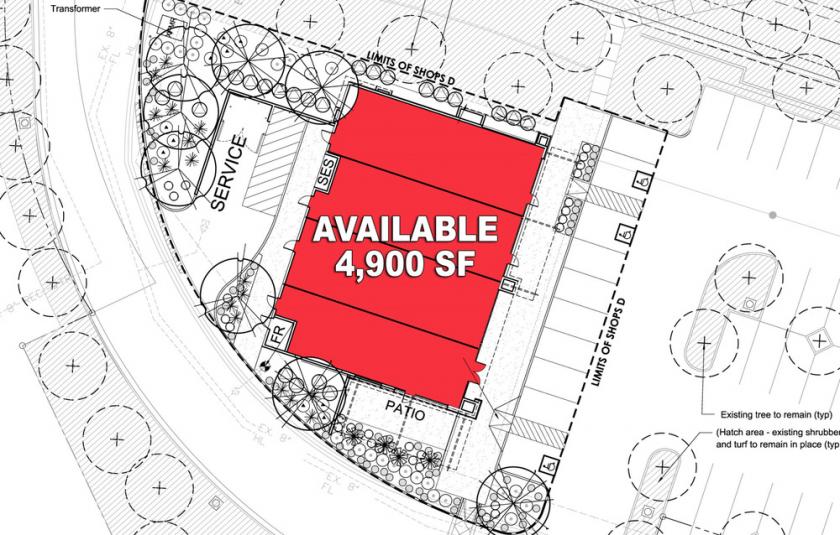
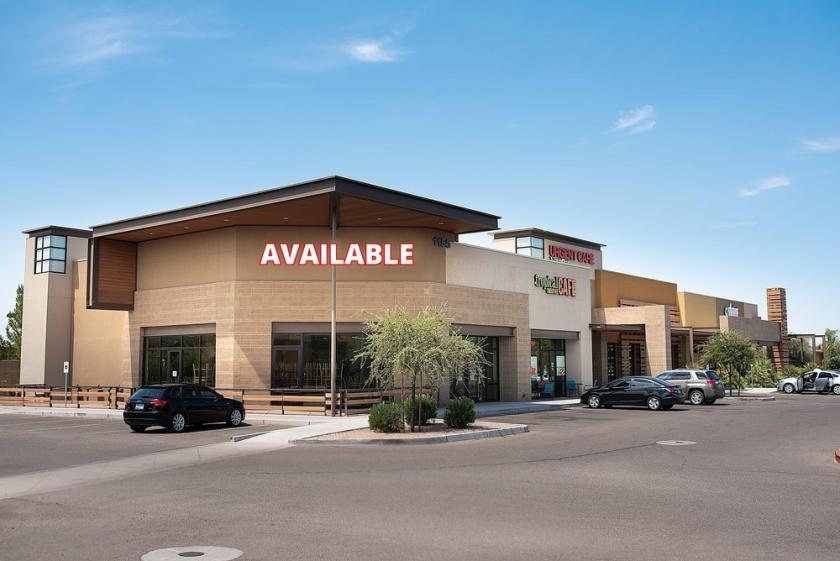
- • Second generation restaurant space available
- • Zoned C-2, City of Chandler
Additional Photos


Listing Agents

Robbie Retty
O: 602-682-6025
M: 602-618-7400
robbie.petty@srsre.com
O: 602-682-6025
M: 602-618-7400
robbie.petty@srsre.com
While we strive to provide the most accurate information, all listing information, and demographic data, is provided by third-parties. As such, MyEListing will not be responsible for the accuracy of the information. It is strongly recommended that you verify all information with the listing agent, and any relevant agencies, prior to making any decisions.


