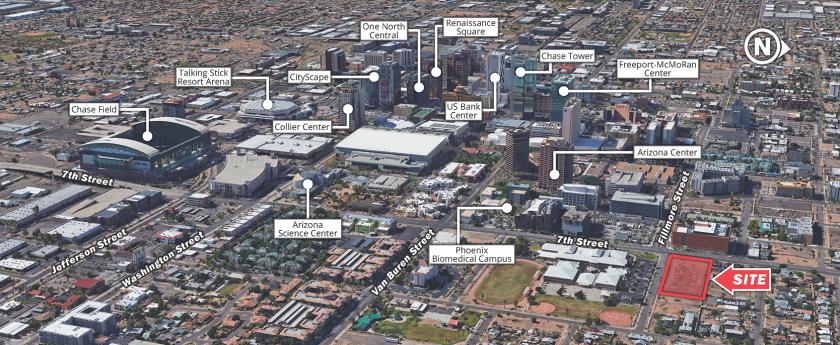
Commercial Land
601 West Fillmore Street Phoenix, AZ 85003
601 West Fillmore Street Phoenix, AZ 85003
Details & Description
Property Highlights
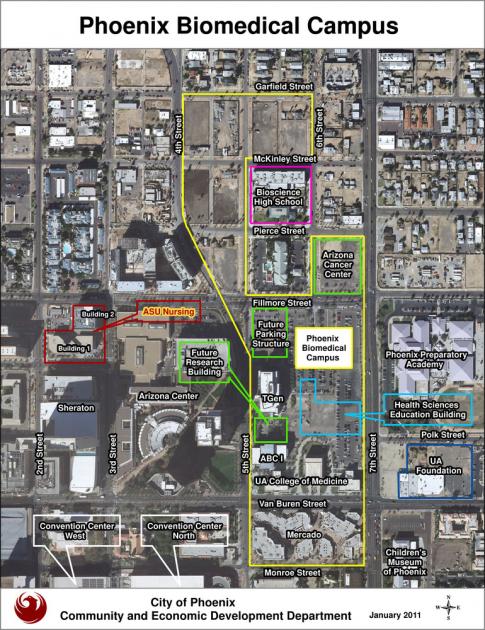
- • Site -2.1 Acres Zoned C-2R-5
- • Close Proximity to Downtown Freeway Exits
- • Excellent Mixed Use Development Potential
- • Within Phoenix Urban Redevelopment Area
Listing Agents

Brian Polachek
O: 602-682-6045
M: 602-292-3100
brian.polachek@srsre.com
O: 602-682-6045
M: 602-292-3100
brian.polachek@srsre.com
While we strive to provide the most accurate information, all listing information, and demographic data, is provided by third-parties. As such, MyEListing will not be responsible for the accuracy of the information. It is strongly recommended that you verify all information with the listing agent, and any relevant agencies, prior to making any decisions.