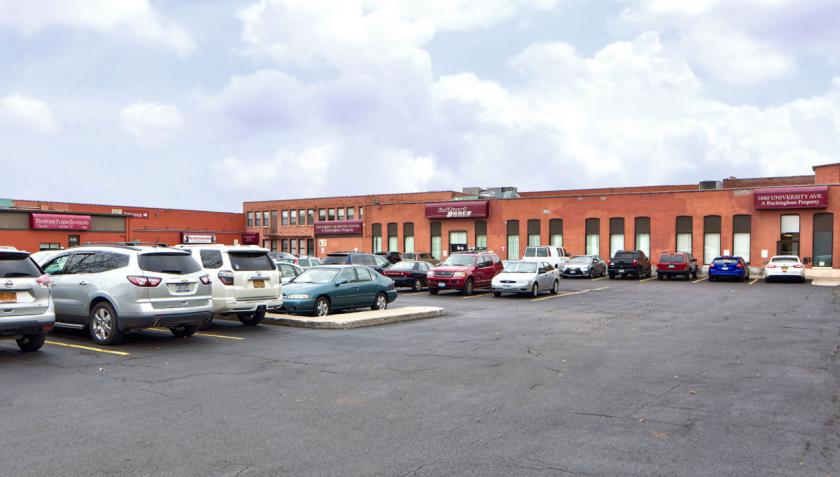
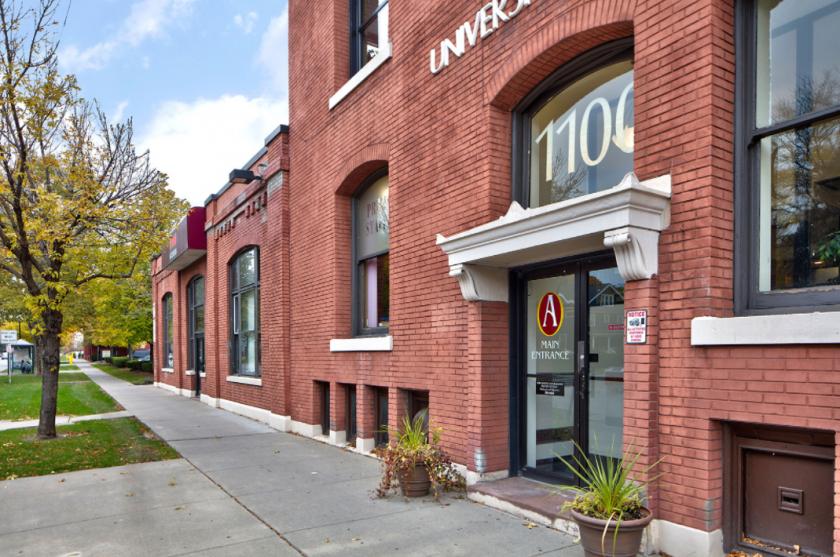
1-Mile | 3-Miles | 5-Miles | ||
---|---|---|---|---|
Total Population | 23,673 | 157,572 | 306,690 | |
Population Median Age | 37 | 37 | 38 | |
Population by Age | 0-9 Yrs | 1714 (7%) | 17884 (11%) | 35464 (11%) |
10-19 Yrs | 1912 (8%) | 17760 (11%) | 39949 (13%) | |
20-29 Yrs | 7315 (30%) | 31567 (20%) | 56249 (18%) | |
30-39 Yrs | 3792 (16%) | 24267 (15%) | 42982 (14%) | |
40-49 Yrs | 2482 (10%) | 17322 (10%) | 32865 (10%) | |
50-59 Yrs | 2456 (10%) | 18894 (11%) | 37551 (12%) | |
60-69 Yrs | 2103 (8%) | 14840 (9%) | 31431 (10%) | |
70+ Yrs | 1899 (8%) | 15039 (9%) | 30200 (9%) | |
Median HH Income | $50,295 | $45,123 | $45,729 | |
Total Household Income | < 24K | 3052 (25%) | 20399 (29%) | 37312 (29%) |
25-49K | 2934 (24%) | 16316 (23%) | 30724 (24%) | |
50-74K | 2560 (21%) | 11662 (17%) | 21166 (16%) | |
75-99K | 1201 (9%) | 6917 (10%) | 13398 (10%) | |
100-199K | 1830 (15%) | 10538 (15%) | 19901 (15%) | |
200K+ | 463 (3%) | 2742 (3%) | 5156 (4%) | |
Highest Education Level | No Diploma | 1674 | 15847 | 29954 |
Diploma or GED | 2785 | 24864 | 48333 | |
Some College | 2697 | 18031 | 34700 | |
Assoc. Degree | 1430 | 9547 | 20215 | |
Bachelors Degree | 4446 | 20784 | 38267 | |
Higher Degree | 3705 | 19111 | 33095 | |
Total Housing Units | 13,464 | 77,989 | 144,401 | |
--Owner-Occupied | 3,381 | 28,803 | 60,367 | |
--Renter-Occupied | 8,660 | 39,770 | 67,290 | |
Owner-Occupied Values | < 100K | 1080 | 10979 | 22624 |
100-199K | 1120 | 11594 | 25102 | |
200-299K | 639 | 3504 | 6910 | |
300-399K | 331 | 1367 | 2979 | |
400-499K | 80 | 513 | 1178 | |
500K+ | 131 | 845 | 1574 | |
Total Working Age Population | 20,655 | 128,720 | 248,824 | |
In Work Force | 14,983 | 84,269 | 156,313 | |
Not In Work Force | 5,673 | 44,451 | 92,511 | |
Workforce Employed | 14,200 | 77,581 | 143,799 | |
Workforce Unemployed | 782 | 6,682 | 12,486 | |
Civlian Workforce | 14,983 | 84,262 | 156,284 | |
Military Workforce | 0 | 7 | 29 | |
Total Households | 12,041 | 68,573 | 127,657 | |
Family Households | 3,950 | 32,688 | 66,238 | |
Non-Family Households | 8,091 | 35,885 | 61,419 | |
Married Couple | 2,139 | 17,100 | 36,457 | |
Other Family | 1,811 | 15,588 | 29,781 | |
Married w/Child | 479 | 6,049 | 13,272 | |
Single Male w/Child | 112 | 990 | 2,419 | |
Single Female w/Child | 856 | 7,800 | 14,823 |
Population Change Last Two Decades - Plus Projection
2000 | % | 2010 | % | 2020 | % | 2030 | |
---|---|---|---|---|---|---|---|
New York | 18,976,457 | +2 | 19,378,102 | +4 | 20,146,131 | +2 | 20,604,030 |
Monroe County | 735,343 | +1 | 744,344 | +1 | 754,529 | +1 | 758,536 |
Total Working Age Population:
Total Households:
Total Working Age Population:
Total Households:
Total Working Age Population:
Total Households: