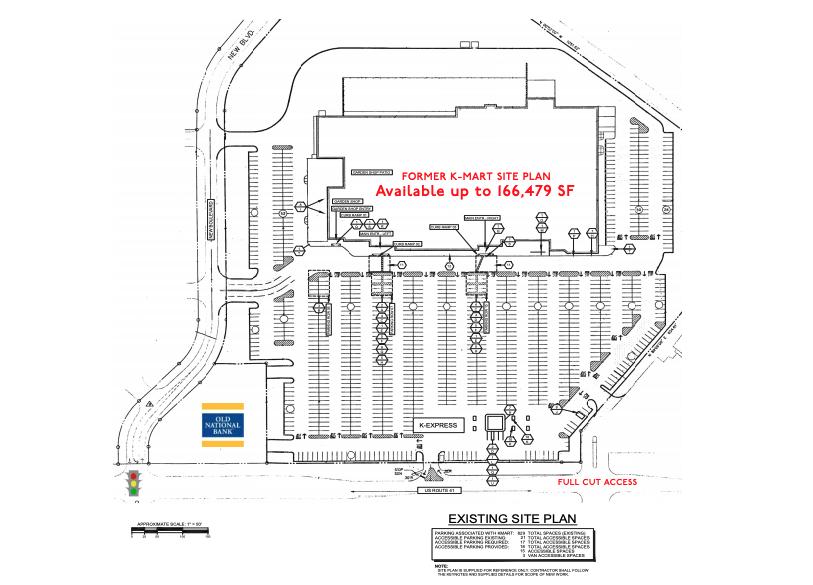
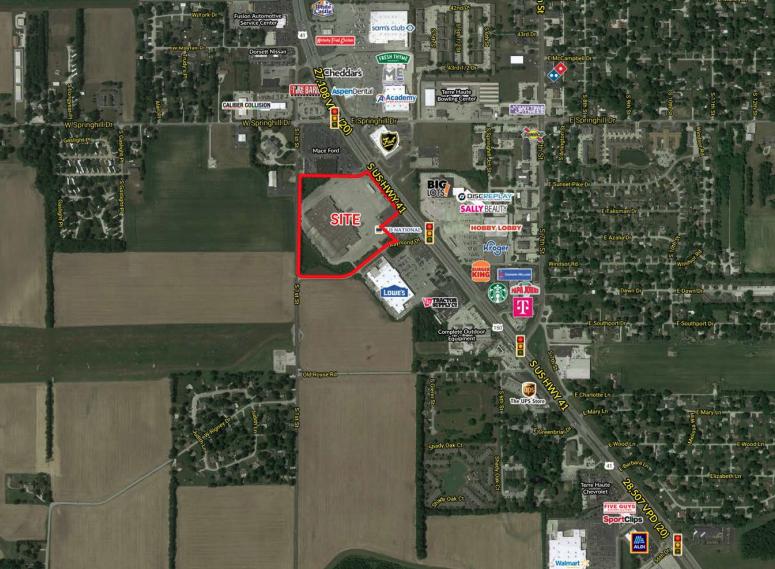
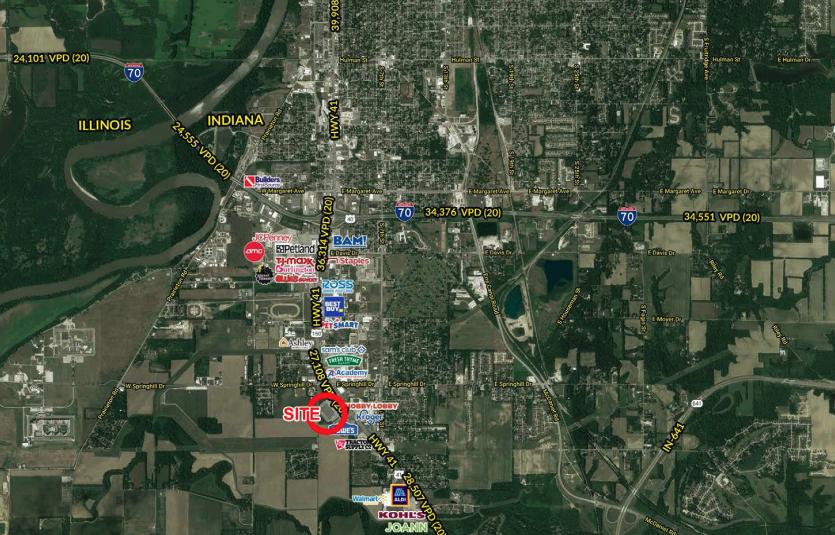
1-Mile | 3-Miles | 5-Miles | ||
---|---|---|---|---|
Total Population | 2,842 | 23,972 | 57,113 | |
Population Median Age | 40 | 38 | 37 | |
Population by Age | 0-9 Yrs | 228 (8%) | 2856 (11%) | 6364 (11%) |
10-19 Yrs | 282 (9%) | 2713 (11%) | 8094 (14%) | |
20-29 Yrs | 448 (15%) | 4314 (17%) | 11297 (19%) | |
30-39 Yrs | 538 (18%) | 3814 (15%) | 7573 (13%) | |
40-49 Yrs | 394 (13%) | 2764 (11%) | 6234 (10%) | |
50-59 Yrs | 387 (13%) | 2900 (12%) | 6628 (11%) | |
60-69 Yrs | 252 (8%) | 2263 (9%) | 5449 (9%) | |
70+ Yrs | 313 (11%) | 2348 (9%) | 5474 (9%) | |
Median HH Income | $44,246 | $39,804 | $40,207 | |
Total Household Income | < 24K | 287 (28%) | 2807 (30%) | 6702 (30%) |
25-49K | 281 (27%) | 2675 (29%) | 6338 (29%) | |
50-74K | 173 (17%) | 1441 (15%) | 3571 (16%) | |
75-99K | 120 (11%) | 977 (10%) | 2354 (10%) | |
100-199K | 116 (11%) | 988 (10%) | 2311 (10%) | |
200K+ | 35 (3%) | 309 (3%) | 575 (2%) | |
Highest Education Level | No Diploma | 285 | 2106 | 4530 |
Diploma or GED | 646 | 4770 | 10753 | |
Some College | 489 | 3799 | 8237 | |
Assoc. Degree | 187 | 1339 | 3050 | |
Bachelors Degree | 367 | 2429 | 5216 | |
Higher Degree | 150 | 1491 | 3638 | |
Total Housing Units | 1,123 | 10,079 | 24,756 | |
--Owner-Occupied | 460 | 4,507 | 11,620 | |
--Renter-Occupied | 551 | 4,690 | 10,232 | |
Owner-Occupied Values | < 100K | 198 | 2254 | 6395 |
100-199K | 193 | 1593 | 3679 | |
200-299K | 22 | 245 | 776 | |
300-399K | 27 | 192 | 361 | |
400-499K | 14 | 134 | 216 | |
500K+ | 6 | 89 | 193 | |
Total Working Age Population | 2,477 | 19,667 | 47,161 | |
In Work Force | 1,113 | 10,865 | 27,530 | |
Not In Work Force | 1,364 | 8,802 | 19,632 | |
Workforce Employed | 1,070 | 10,230 | 25,422 | |
Workforce Unemployed | 41 | 616 | 2,064 | |
Civlian Workforce | 1,110 | 10,847 | 27,485 | |
Military Workforce | 3 | 18 | 45 | |
Total Households | 1,011 | 9,197 | 21,852 | |
Family Households | 501 | 5,074 | 12,062 | |
Non-Family Households | 510 | 4,123 | 9,789 | |
Married Couple | 348 | 3,252 | 7,935 | |
Other Family | 152 | 1,822 | 4,128 | |
Married w/Child | 126 | 1,404 | 3,206 | |
Single Male w/Child | 25 | 263 | 609 | |
Single Female w/Child | 69 | 904 | 1,734 |
Population Change Last Two Decades - Plus Projection
2000 | % | 2010 | % | 2020 | % | 2030 | |
---|---|---|---|---|---|---|---|
Indiana | 6,080,485 | +7 | 6,483,802 | +4 | 6,738,573 | +4 | 7,014,880 |
Vigo County | 105,848 | +2 | 107,848 | 0 | 107,795 | 0 | 107,777 |
Total Working Age Population:
Total Households:
Total Working Age Population:
Total Households:
Total Working Age Population:
Total Households: