Commercial Land
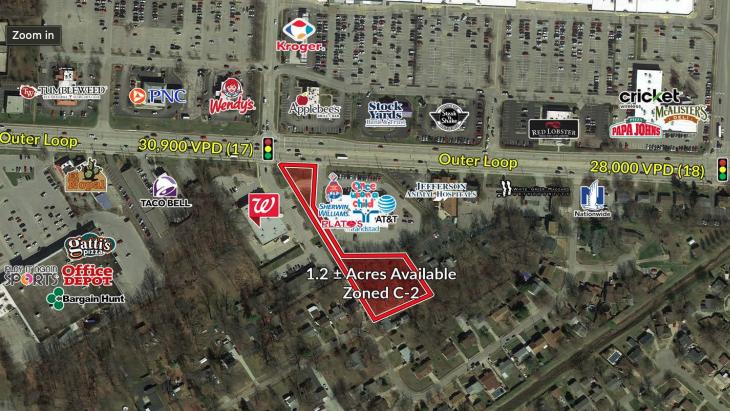
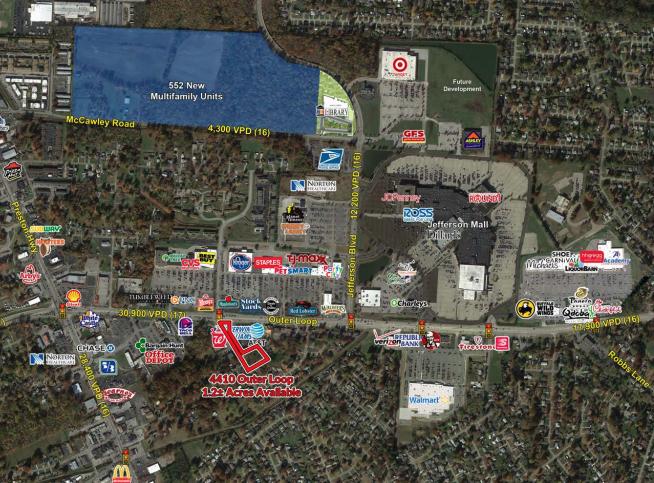
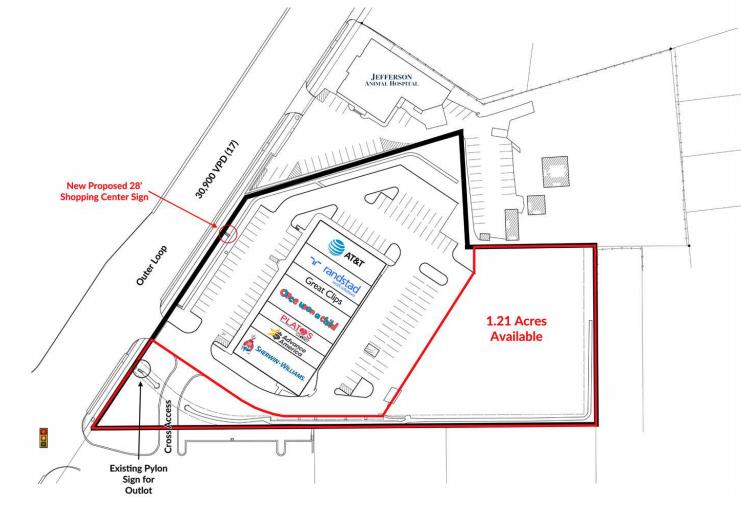
4410 Outer Loop Louisville, KY 40219
4410 Outer Loop Louisville, KY 40219
Details & Description
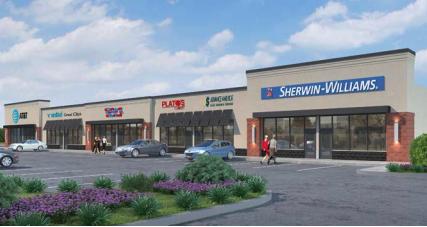
Additional Photos

Listing Agents

Justin Phelps
O: 502-271-5820
jphelps@hogandev.com
O: 502-271-5820
jphelps@hogandev.com
While we strive to provide the most accurate information, all listing information, and demographic data, is provided by third-parties. As such, MyEListing will not be responsible for the accuracy of the information. It is strongly recommended that you verify all information with the listing agent, and any relevant agencies, prior to making any decisions.


