Industrial Properties
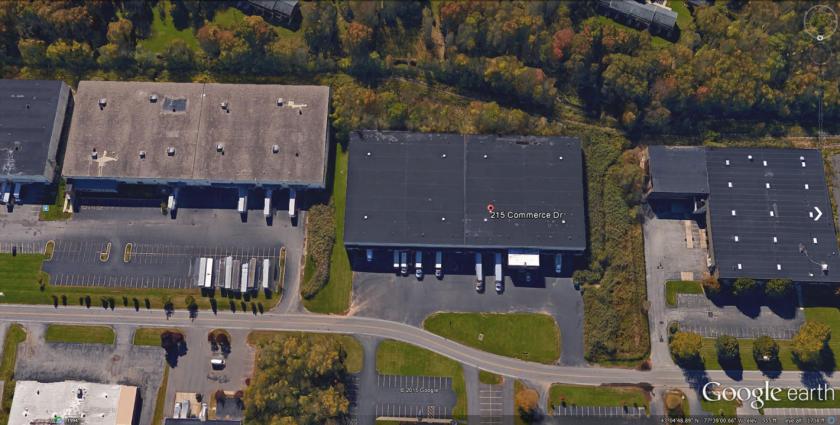
215 Commerce Drive Rochester, NY 14623
215 Commerce Drive Rochester, NY 14623
Details & Description
Property Highlights
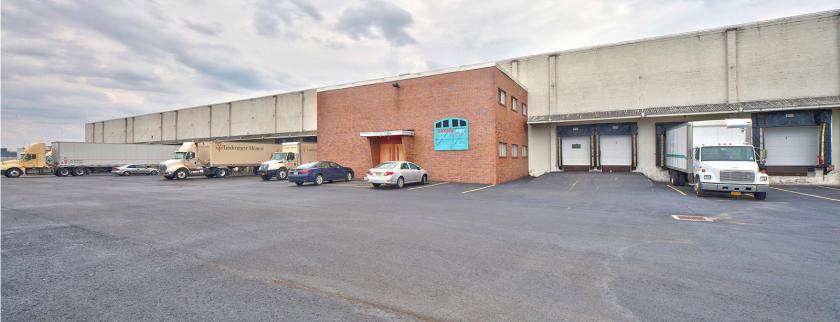
- • 15 docks
- • Wet sprinklers throughout
- • On-site parking for cars and trailers
- • Concrete block and steel frame construction
- • Minutes from I-390 and the NYS Thruway
Listing Agents

Adam Borrell
O: 585-287-5861
aborrell@buckprop.com
O: 585-287-5861
aborrell@buckprop.com
While we strive to provide the most accurate information, all listing information, and demographic data, is provided by third-parties. As such, MyEListing will not be responsible for the accuracy of the information. It is strongly recommended that you verify all information with the listing agent, and any relevant agencies, prior to making any decisions.