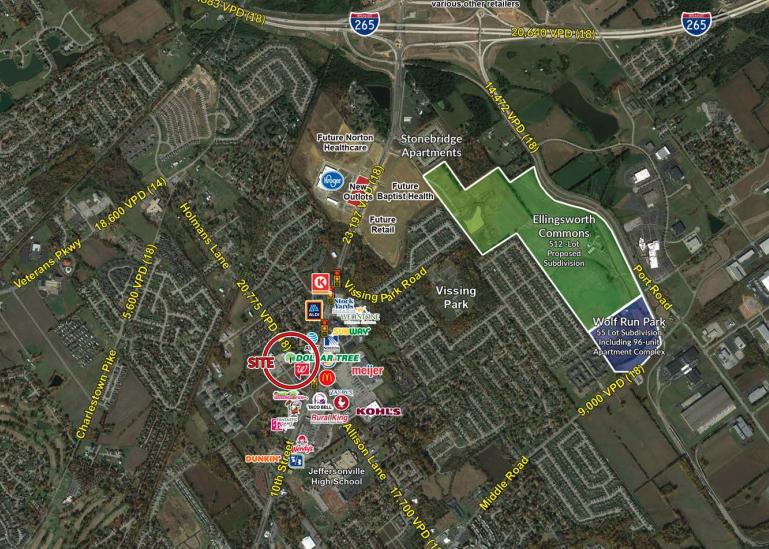
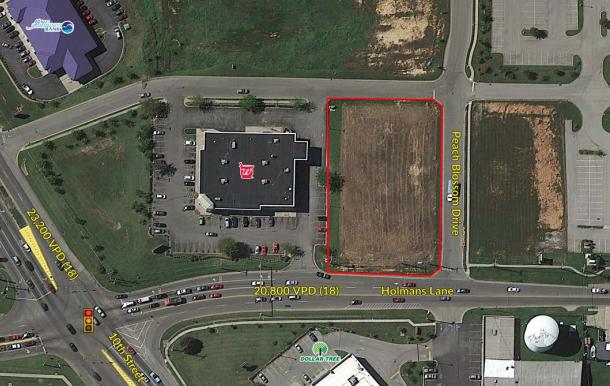
1-Mile | 3-Miles | 5-Miles | ||
---|---|---|---|---|
Total Population | 9,144 | 45,825 | 115,162 | |
Population Median Age | 38 | 39 | 40 | |
Population by Age | 0-9 Yrs | 1117 (12%) | 5908 (12%) | 12699 (11%) |
10-19 Yrs | 1141 (12%) | 5445 (11%) | 12738 (11%) | |
20-29 Yrs | 1667 (18%) | 6471 (14%) | 16427 (14%) | |
30-39 Yrs | 1296 (14%) | 6479 (14%) | 16473 (14%) | |
40-49 Yrs | 1039 (11%) | 5420 (11%) | 14841 (12%) | |
50-59 Yrs | 794 (8%) | 5674 (12%) | 15023 (13%) | |
60-69 Yrs | 1216 (13%) | 5764 (12%) | 14322 (12%) | |
70+ Yrs | 874 (9%) | 4664 (10%) | 12638 (10%) | |
Median HH Income | $51,500 | $54,107 | $56,394 | |
Total Household Income | < 24K | 583 (16%) | 3293 (18%) | 8445 (18%) |
25-49K | 1116 (31%) | 4922 (27%) | 12168 (26%) | |
50-74K | 700 (19%) | 4033 (22%) | 9061 (19%) | |
75-99K | 467 (13%) | 2607 (14%) | 5921 (12%) | |
100-199K | 567 (16%) | 2637 (14%) | 7736 (16%) | |
200K+ | 82 (2%) | 482 (2%) | 3085 (6%) | |
Highest Education Level | No Diploma | 489 | 3034 | 7618 |
Diploma or GED | 1954 | 10927 | 24114 | |
Some College | 1319 | 7501 | 17531 | |
Assoc. Degree | 748 | 3263 | 7039 | |
Bachelors Degree | 1058 | 4676 | 15914 | |
Higher Degree | 591 | 2382 | 10380 | |
Total Housing Units | 4,125 | 20,586 | 53,252 | |
--Owner-Occupied | 1,997 | 11,512 | 29,579 | |
--Renter-Occupied | 1,517 | 6,461 | 16,837 | |
Owner-Occupied Values | < 100K | 341 | 2742 | 6431 |
100-199K | 1293 | 6537 | 13183 | |
200-299K | 260 | 1351 | 3997 | |
300-399K | 41 | 363 | 1956 | |
400-499K | 4 | 80 | 1043 | |
500K+ | 58 | 439 | 2969 | |
Total Working Age Population | 7,388 | 36,629 | 94,476 | |
In Work Force | 4,903 | 23,997 | 60,454 | |
Not In Work Force | 2,486 | 12,632 | 34,022 | |
Workforce Employed | 4,617 | 22,595 | 57,430 | |
Workforce Unemployed | 285 | 1,381 | 2,987 | |
Civlian Workforce | 4,903 | 23,976 | 60,416 | |
Military Workforce | 0 | 21 | 37 | |
Total Households | 3,514 | 17,973 | 46,416 | |
Family Households | 2,245 | 11,294 | 26,658 | |
Non-Family Households | 1,269 | 6,679 | 19,758 | |
Married Couple | 1,646 | 8,024 | 19,398 | |
Other Family | 599 | 3,270 | 7,260 | |
Married w/Child | 602 | 2,851 | 6,798 | |
Single Male w/Child | 112 | 484 | 1,034 | |
Single Female w/Child | 214 | 1,255 | 2,713 |
Population Change Last Two Decades - Plus Projection
2000 | % | 2010 | % | 2020 | % | 2030 | |
---|---|---|---|---|---|---|---|
Indiana | 6,080,485 | +7 | 6,483,802 | +4 | 6,738,573 | +4 | 7,014,880 |
Clark County | 96,472 | +14 | 110,232 | +9 | 119,944 | +8 | 129,070 |
Floyd County | 70,823 | +5 | 74,578 | +6 | 78,826 | +3 | 81,345 |
Kentucky | 4,041,769 | +7 | 4,339,367 | +4 | 4,533,464 | +4 | 4,726,382 |
Jefferson County | 693,604 | +7 | 741,096 | +7 | 790,010 | +6 | 837,477 |
Oldham County | 46,178 | +31 | 60,316 | +15 | 69,419 | +18 | 81,831 |
Total Working Age Population:
Total Households:
Total Working Age Population:
Total Households:
Total Working Age Population:
Total Households: