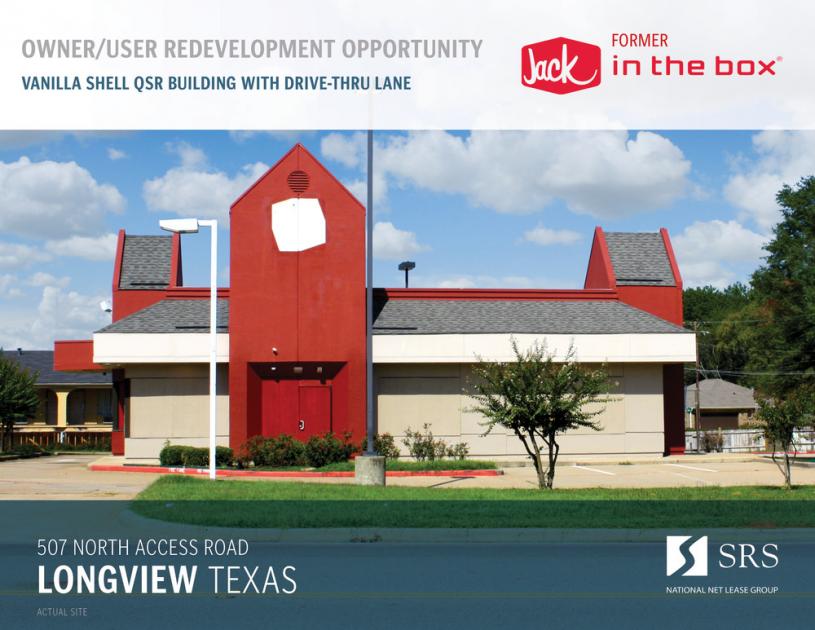
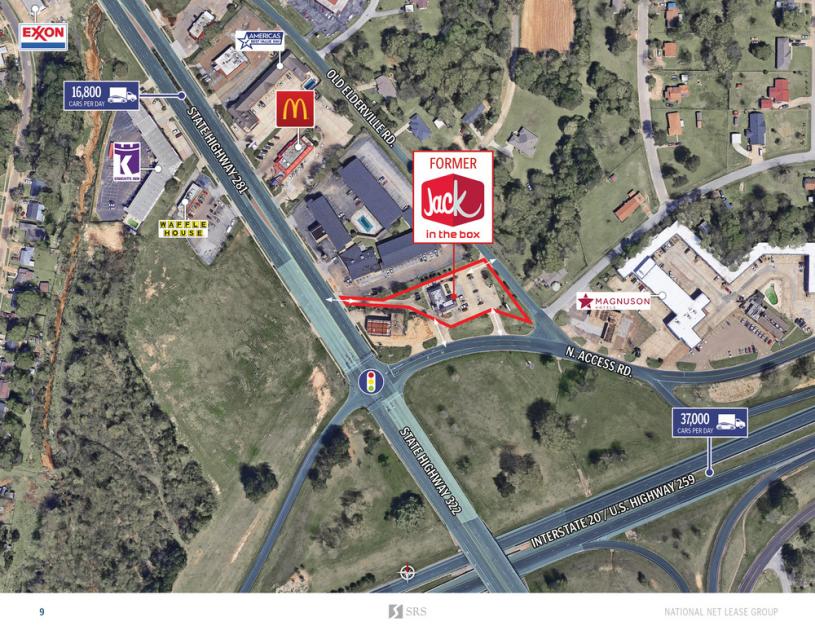
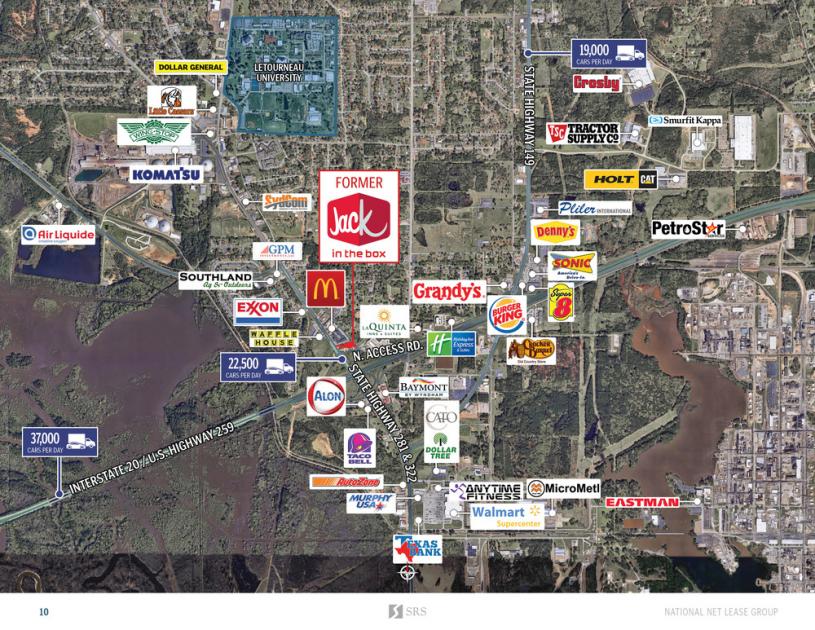
SRS National Net Lease Group is pleased to offer the opportunity to acquire the fee simple interest (land & building ownership) in a freestanding, corporate guaranteed, former Jack in the Box property located in Longview, Texas. The tenant, Jack In The Box Eastern Division L.P., is no longer occupying the property but is still paying rent as per their lease through April 2022. The building was constructed in 1999 and in currently in vanilla shell condition, limiting required build-out costs and required capital expenditures for a new owner. The property is zoned C - Heavy Commercial, permitting a wide range of uses. This opportunity allows an investor to collect income while seeking a new or replacement tenant. The going in yield/cap rate of 10% provides an attractive, above market return for 2 years of remaining lease term, backed by Jack in the Box corporate credit (S&P: A-).The subject property is strategically located on State Highway 281, averaging 22,500 vehicles passing by daily, and directly off Interstate 20 (37,000 VPD), with convenient on/off ramp access. The site is positioned within the Interstate-20 Corridor, which is offering numerous incentives to promote business growth including low-interest loans, tax abatements, training grants, enterprise zones and projects, sales tax refunds, franchise tax refunds, and freeport exemptions. Moreover, the site is just north of East Texas Regional Airport, which is expected to undergo $72 million in facility and infrastructure upgrades. Nearby national/credit tenants include a 24-hour Walmart Supercenter, Anytime Fitness, Dollar Tree, AutoZone, and more, increasing consumer traffic and draw to the site. Additionally, the site is just 1.5 miles south of LeTourneau University (3,200 students enrolled) and 2 miles north of Eastman Chemical (1,400+ employees), the 2nd largest employer in Longview, providing a strong customer base to draw from. The 5-mile trade is supported by a population of nearly 38,000 residents with an average household income of $51,098.