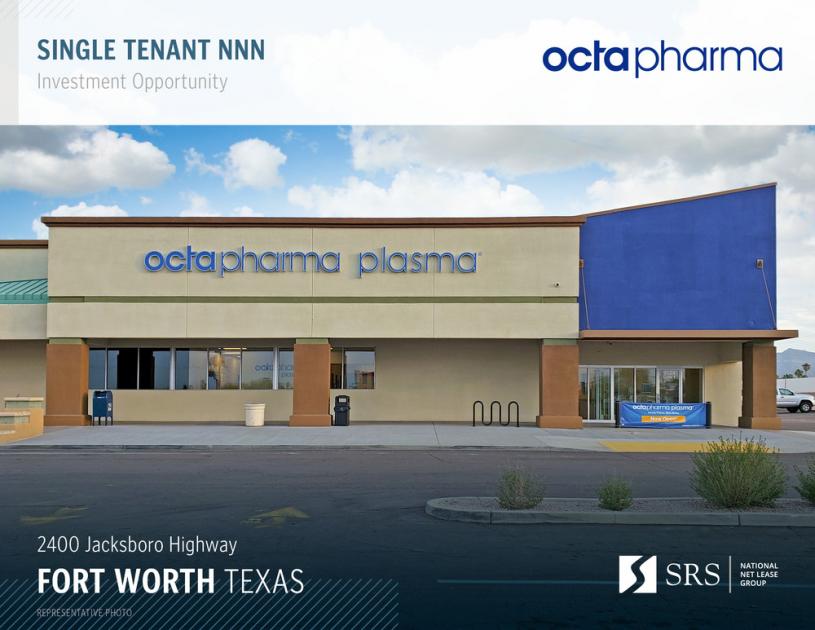
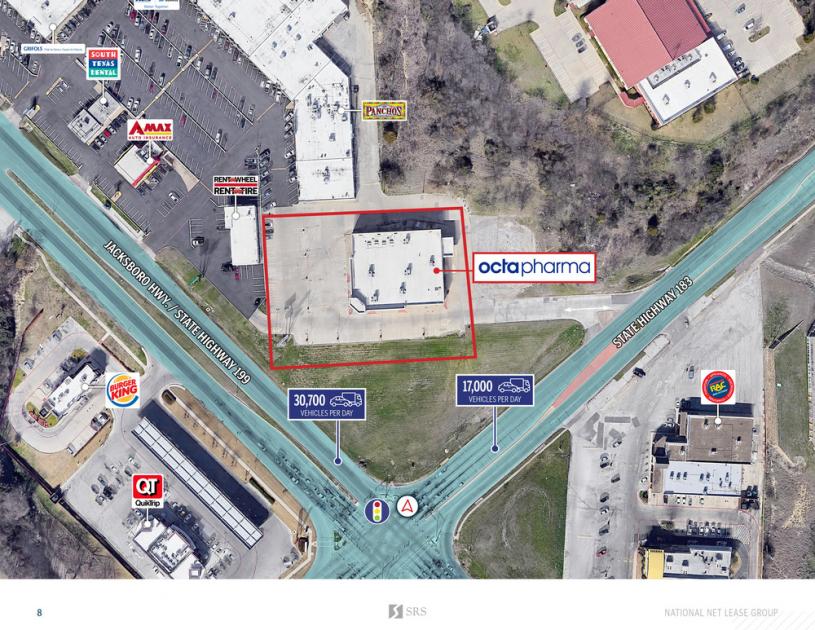
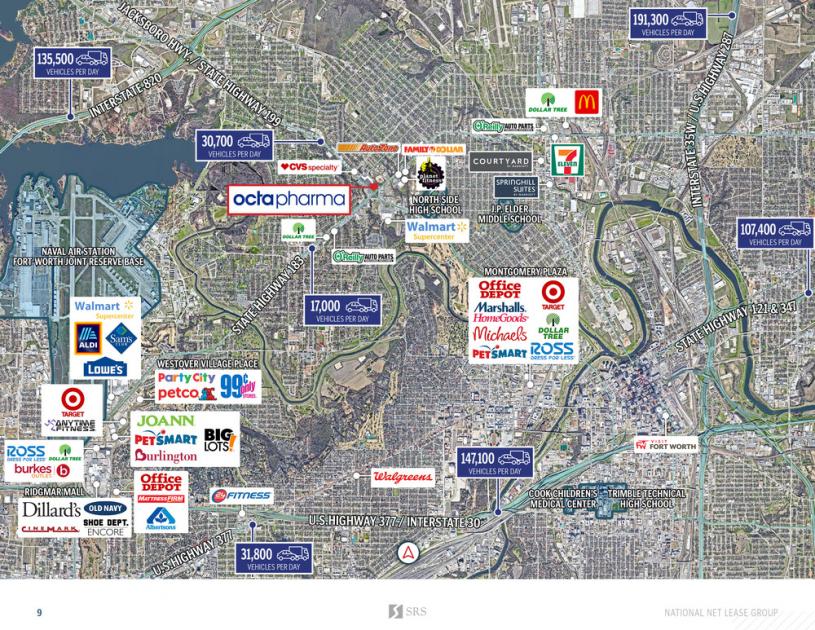
SRS National Net Lease Group is pleased to offer the opportunity to acquire the fee simple interest (land & building ownership) in a NNN leased, corporate signed, freestanding, Octapharma investment property located in Fort Worth, Texas (Dallas-Fort Worth MSA). The tenant, Octapharma Plasma, Inc., recently signed a brand new 12-year lease with 3 (5-year) options to extend, demonstrating their commitment to the site. The lease features a 10% rental increase in April 2027and at the beginning of each option period, growing NOI and hedging against inflation. The lease is signed by the corporate entity and is NNN with landlord responsibilities limited to roof and structure, making it an ideal, low-management investment opportunity for a passive investor. Octapharma Plasma, Inc. runs more than 80 donation centers in the U.S. and employ more than 3,500 people nationally. Octapharma Plasma is part of Octapharma AG, one of the world’s largest makers of plasma products.The subject property is strategically located at the signalized, hard corner of Jacksboro Highway and Ephriham Avenue, averaging a combined 47,700 vehicles passing by daily. The site benefits from excellent visibility via significant street frontage and a large pylon sign along Jackson Highway. The asset is ideally situated near Walmart Supercenter, a premium retailer that significantly increases consumer draw to the immediate trade area and promotes crossover store exposure for the site. State Highway 183 is one of the major retail corridors traveling through Fort Worth, featuring a variety of other national/credit tenants including Target, Lowe’s Home Improvement, Sam’s Club, Burlington, Office Depot, Ross Dress for Less, Dollar Tree, and more, further increasing consumer traffic to the area. In addition, the site is located in the heart of a dense, heavily populated neighborhood, providing Octapharma Plasma with a large pool of potential donors. The 5-mile trade area is supported by more than 215,000 residents and 174,000 daytime employees with an average household income of $77,000.