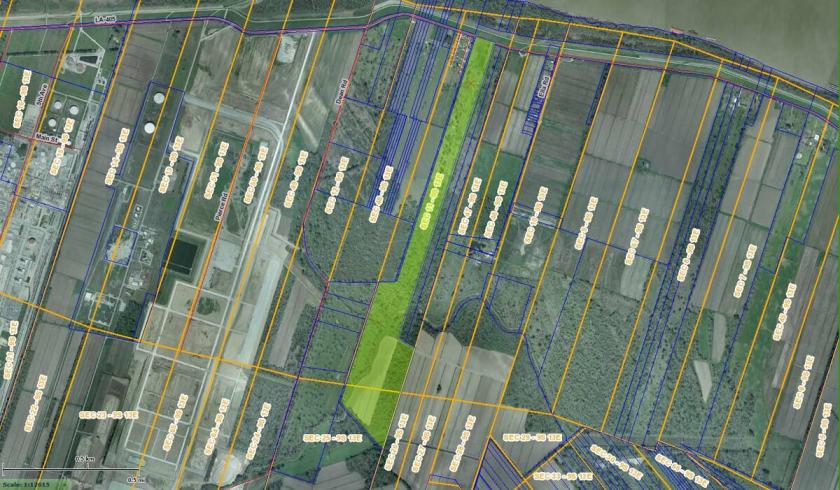
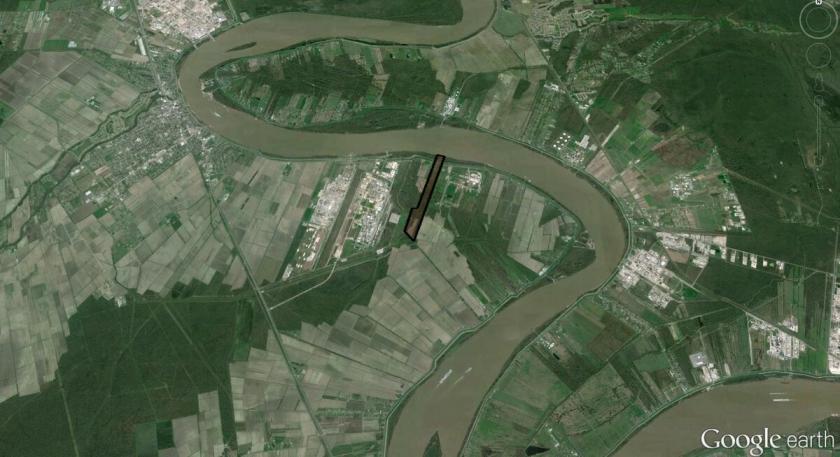
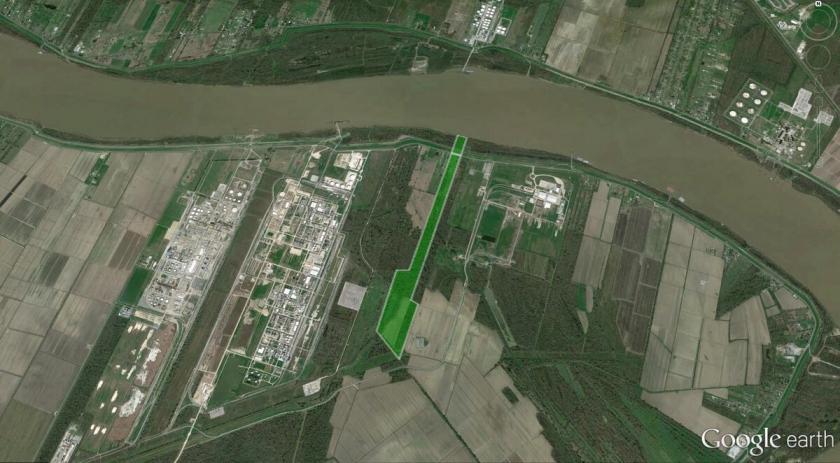
1-Mile | 3-Miles | 5-Miles | ||
---|---|---|---|---|
Total Population | 401 | 3,387 | 15,270 | |
Population Median Age | 42 | 42 | 39 | |
Population by Age | 0-9 Yrs | 34 (8%) | 283 (8%) | 1825 (11%) |
10-19 Yrs | 59 (14%) | 454 (13%) | 1522 (9%) | |
20-29 Yrs | 47 (11%) | 474 (13%) | 2419 (15%) | |
30-39 Yrs | 58 (14%) | 538 (15%) | 2610 (17%) | |
40-49 Yrs | 49 (12%) | 303 (8%) | 1618 (10%) | |
50-59 Yrs | 38 (9%) | 395 (11%) | 1997 (13%) | |
60-69 Yrs | 48 (11%) | 405 (11%) | 1563 (10%) | |
70+ Yrs | 68 (16%) | 536 (15%) | 1716 (11%) | |
Median HH Income | $49,499 | $51,112 | $54,445 | |
Total Household Income | < 24K | 37 (26%) | 301 (24%) | 1131 (23%) |
25-49K | 34 (24%) | 284 (23%) | 1003 (21%) | |
50-74K | 32 (22%) | 273 (22%) | 956 (20%) | |
75-99K | 26 (18%) | 189 (15%) | 549 (11%) | |
100-199K | 8 (5%) | 137 (11%) | 847 (17%) | |
200K+ | 3 (2%) | 23 (1%) | 255 (5%) | |
Highest Education Level | No Diploma | 39 | 323 | 2009 |
Diploma or GED | 125 | 1155 | 4326 | |
Some College | 73 | 548 | 2112 | |
Assoc. Degree | 18 | 209 | 847 | |
Bachelors Degree | 19 | 199 | 1158 | |
Higher Degree | 9 | 63 | 416 | |
Total Housing Units | 180 | 1,463 | 5,758 | |
--Owner-Occupied | 103 | 896 | 3,265 | |
--Renter-Occupied | 36 | 310 | 1,476 | |
Owner-Occupied Values | < 100K | 39 | 326 | 930 |
100-199K | 50 | 368 | 1149 | |
200-299K | 10 | 95 | 647 | |
300-399K | 1 | 30 | 176 | |
400-499K | 2 | 7 | 89 | |
500K+ | 1 | 69 | 274 | |
Total Working Age Population | 326 | 2,831 | 12,514 | |
In Work Force | 193 | 1,640 | 6,518 | |
Not In Work Force | 132 | 1,191 | 5,996 | |
Workforce Employed | 174 | 1,537 | 5,994 | |
Workforce Unemployed | 18 | 90 | 455 | |
Civlian Workforce | 191 | 1,628 | 6,449 | |
Military Workforce | 2 | 12 | 69 | |
Total Households | 140 | 1,206 | 4,741 | |
Family Households | 105 | 929 | 3,183 | |
Non-Family Households | 35 | 277 | 1,558 | |
Married Couple | 69 | 538 | 1,832 | |
Other Family | 37 | 392 | 1,351 | |
Married w/Child | 15 | 99 | 533 | |
Single Male w/Child | 5 | 58 | 169 | |
Single Female w/Child | 5 | 84 | 428 |
Population Change Last Two Decades - Plus Projection
2000 | % | 2010 | % | 2020 | % | 2030 | |
---|---|---|---|---|---|---|---|
Louisiana | 4,468,976 | +1 | 4,533,372 | +1 | 4,588,310 | +5 | 4,813,420 |
Ascension Parish | 76,627 | +40 | 107,215 | +38 | 147,740 | +33 | 196,140 |
East Baton Rouge Parish | 412,852 | +7 | 440,171 | -3 | 426,380 | -1 | 421,500 |
Iberville Parish | 33,320 | 0 | 33,387 | -17 | 27,830 | -11 | 24,640 |
St. Martin Parish | 48,583 | +7 | 52,160 | +6 | 55,520 | +3 | 57,000 |
West Baton Rouge Parish | 21,601 | +10 | 23,788 | -7 | 22,220 | -5 | 21,070 |
Total Working Age Population:
Total Households:
Total Working Age Population:
Total Households:
Total Working Age Population:
Total Households: