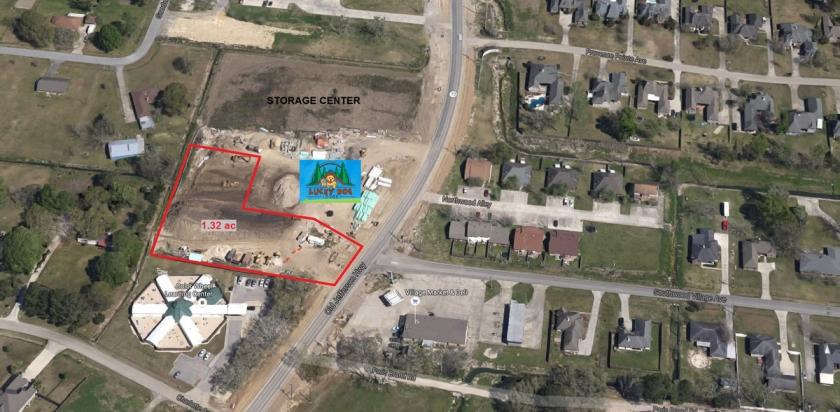
Commercial Land
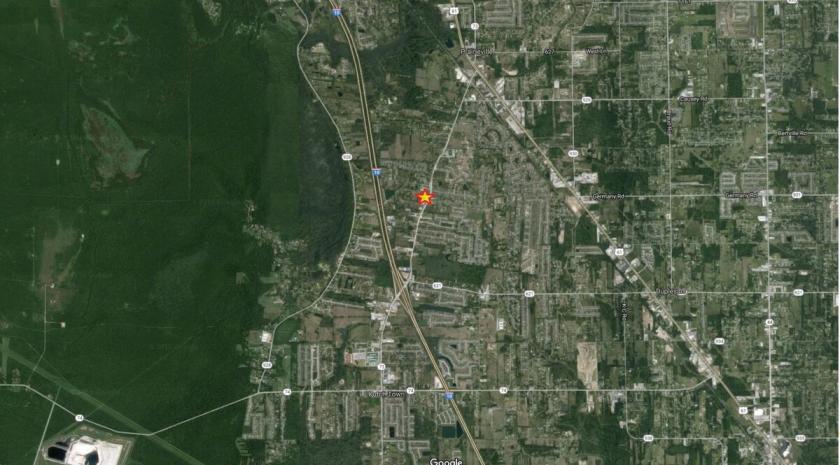
Hwy 73 and Southwood Village Ave Prairieville, LA 70769
Hwy 73 and Southwood Village Ave Prairieville, LA 70769
Details & Description
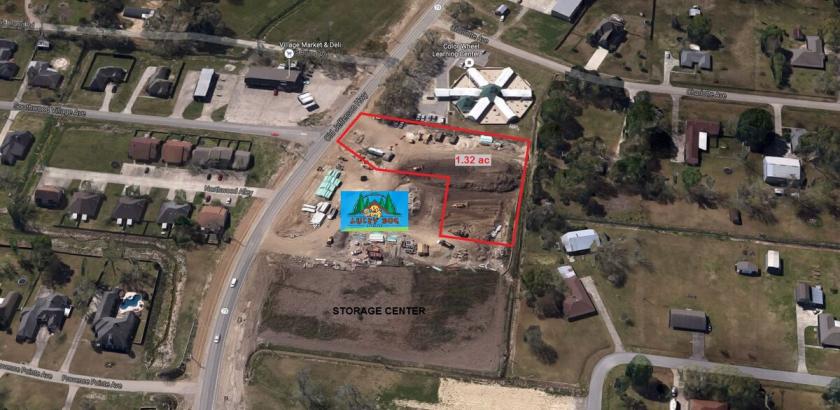
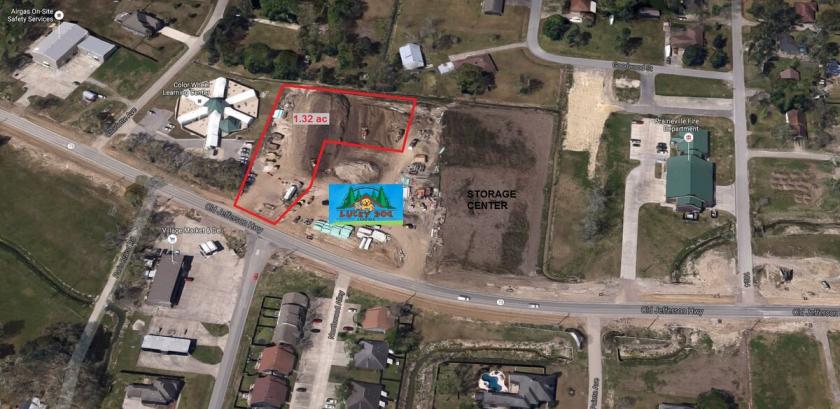
Additional Photos
Listing Agents

Mark Hebert
O: 225-925-0600
mark@kurzhebert.com
O: 225-925-0600
mark@kurzhebert.com
While we strive to provide the most accurate information, all listing information, and demographic data, is provided by third-parties. As such, MyEListing will not be responsible for the accuracy of the information. It is strongly recommended that you verify all information with the listing agent, and any relevant agencies, prior to making any decisions.


