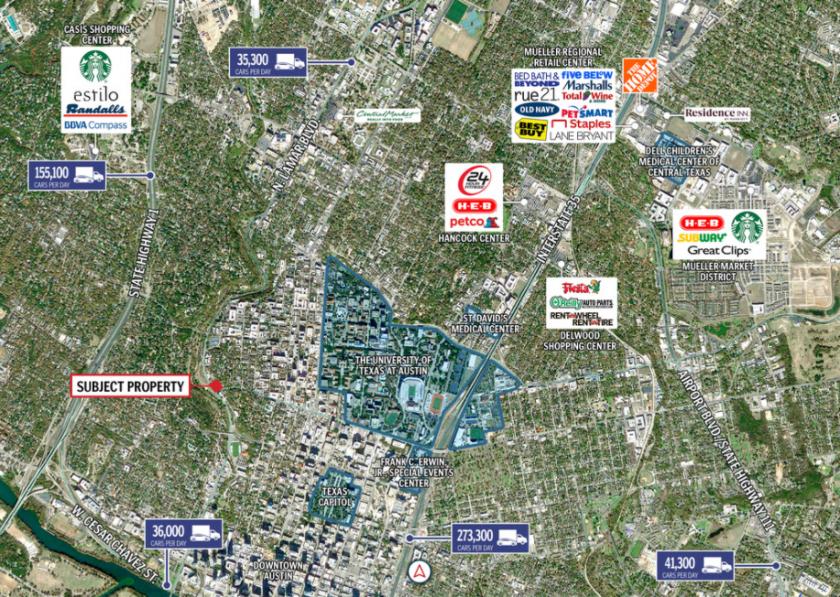
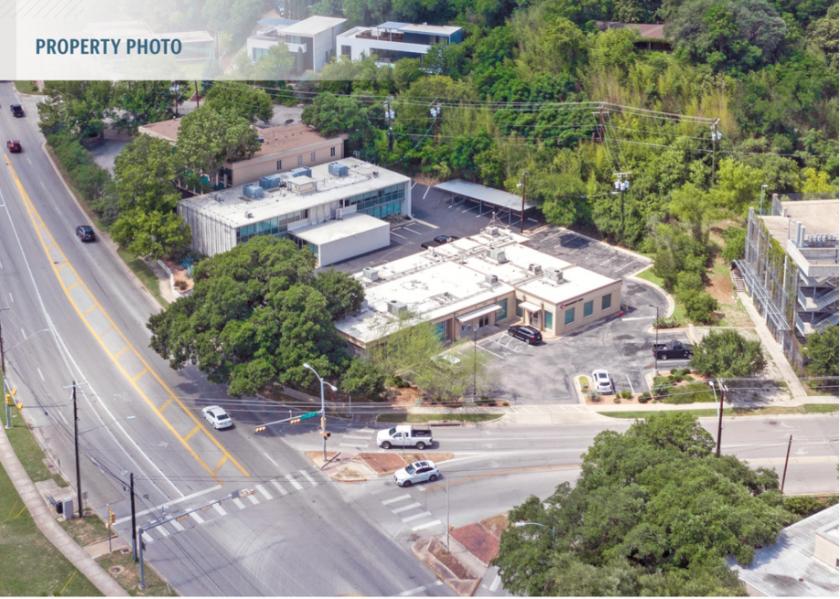
SRS National Net Lease Group is pleased to offer the opportunity to acquire the fee simple interest (land & building ownership) in a 7,693 SF freestanding building (former Benchmark Bank) situated on a 0.51 acre lot in Austin, Texas. The property is zoned LR: Neighborhood Commercial which provides for a wide range of commercial uses. The offering presents excellent upside potential through re-lease and/or the opportunity of new development. The 0.51 acre parcel includes 21 parking spaces.The subject property is located at the signalized, hard corner intersection of N. Lamar Boulevard and W. Martin Luther King Jr. Drive, averaging 45,700 combined vehicles passing by daily. The property benefits from nearby direct on/off ramp access to Interstate 35 (273,300 VPD), a major north/south commuter thoroughfare traveling throughout Austin, and also the primary highway connecting the region to the metropolitan cities of San Antonio and Dallas. The property is located just 1 mile west of The University of Texas at Austin, a public research university home to more than 51,000 students and 3,000 faculty members. UT Austin is the flagship school of the University of Texas System, which includes nine academic universities and six health institutions statewide. According to U.S. News & World Report, UT Austin is ranked in the top 20 for all public universities and the No. 1 accounting, Latin American History, and petroleum engineering graduate programs in the country. In addition, the property is positioned just 1 mile north of the Texas Capitol and Downtown Austin. The Texas Capitol is widely recognized as one of the nation’s most distinguished state capitols, placed on the National Register of Historic Places in 1970 and designated a National Historic Landmark in 1986. Moreover, the asset is surrounded by several apartment complexes including West 24th Street Apartments (80 units), 24 Longview (70 units), Lorrain (28 units), and Lantana (50 units). The 5-mile trade area is supported by more than 359,000 residents and 334,500 daytime employees. Residents within 3 miles of the subject property boast an affluent average household income of $111,000.