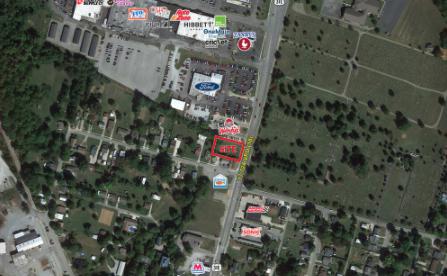
1-Mile | 3-Miles | 5-Miles | ||
---|---|---|---|---|
Total Population | 3,703 | 16,213 | 23,361 | |
Population Median Age | 39 | 37 | 37 | |
Population by Age | 0-9 Yrs | 455 (12%) | 2169 (13%) | 3114 (13%) |
10-19 Yrs | 501 (13%) | 2265 (13%) | 3207 (13%) | |
20-29 Yrs | 589 (15%) | 2723 (16%) | 3487 (14%) | |
30-39 Yrs | 395 (10%) | 1909 (11%) | 2810 (12%) | |
40-49 Yrs | 484 (13%) | 2106 (12%) | 3054 (13%) | |
50-59 Yrs | 396 (10%) | 1846 (11%) | 2846 (12%) | |
60-69 Yrs | 428 (11%) | 1784 (11%) | 2733 (11%) | |
70+ Yrs | 455 (12%) | 1412 (8%) | 2110 (9%) | |
Median HH Income | $51,750 | $57,164 | $59,285 | |
Total Household Income | < 24K | 351 (22%) | 1041 (16%) | 1441 (15%) |
25-49K | 400 (25%) | 1512 (23%) | 2133 (23%) | |
50-74K | 425 (26%) | 1741 (27%) | 2270 (24%) | |
75-99K | 97 (6%) | 748 (11%) | 1261 (13%) | |
100-199K | 250 (15%) | 1102 (17%) | 1656 (18%) | |
200K+ | 60 (3%) | 232 (3%) | 355 (3%) | |
Highest Education Level | No Diploma | 277 | 1127 | 1527 |
Diploma or GED | 802 | 3375 | 5178 | |
Some College | 632 | 2790 | 4009 | |
Assoc. Degree | 171 | 1134 | 1677 | |
Bachelors Degree | 355 | 1171 | 1703 | |
Higher Degree | 203 | 855 | 1268 | |
Total Housing Units | 1,713 | 6,936 | 9,835 | |
--Owner-Occupied | 797 | 4,129 | 6,436 | |
--Renter-Occupied | 786 | 2,247 | 2,680 | |
Owner-Occupied Values | < 100K | 210 | 1153 | 1552 |
100-199K | 367 | 2027 | 3192 | |
200-299K | 107 | 596 | 1068 | |
300-399K | 79 | 230 | 373 | |
400-499K | 27 | 101 | 168 | |
500K+ | 7 | 22 | 83 | |
Total Working Age Population | 2,951 | 12,620 | 18,189 | |
In Work Force | 1,791 | 8,226 | 11,838 | |
Not In Work Force | 1,160 | 4,393 | 6,351 | |
Workforce Employed | 1,708 | 7,819 | 11,197 | |
Workforce Unemployed | 83 | 406 | 626 | |
Civlian Workforce | 1,791 | 8,225 | 11,823 | |
Military Workforce | 0 | 1 | 15 | |
Total Households | 1,582 | 6,375 | 9,116 | |
Family Households | 774 | 3,926 | 5,902 | |
Non-Family Households | 808 | 2,449 | 3,215 | |
Married Couple | 502 | 2,812 | 4,389 | |
Other Family | 272 | 1,114 | 1,512 | |
Married w/Child | 225 | 1,230 | 1,850 | |
Single Male w/Child | 61 | 192 | 254 | |
Single Female w/Child | 95 | 404 | 538 |
Population Change Last Two Decades - Plus Projection
2000 | % | 2010 | % | 2020 | % | 2030 | |
---|---|---|---|---|---|---|---|
Kentucky | 4,041,769 | +7 | 4,339,367 | +4 | 4,533,464 | +4 | 4,726,382 |
Bullitt County | 61,236 | +21 | 74,319 | +12 | 83,186 | +10 | 91,527 |
Nelson County | 37,477 | +16 | 43,437 | +9 | 47,473 | +9 | 51,695 |
Washington County | 10,916 | +7 | 11,717 | +5 | 12,354 | +4 | 12,904 |
Total Working Age Population:
Total Households:
Total Working Age Population:
Total Households:
Total Working Age Population:
Total Households: