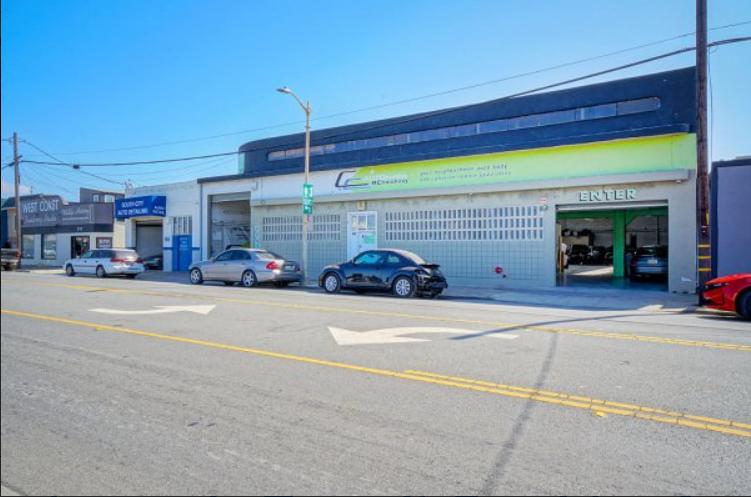
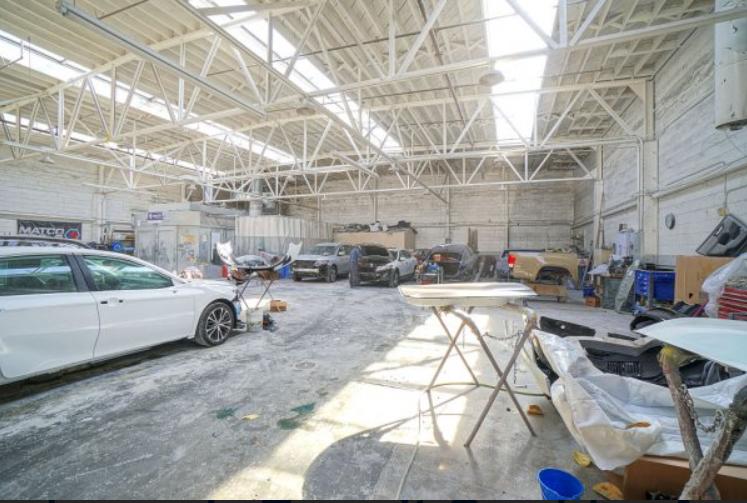
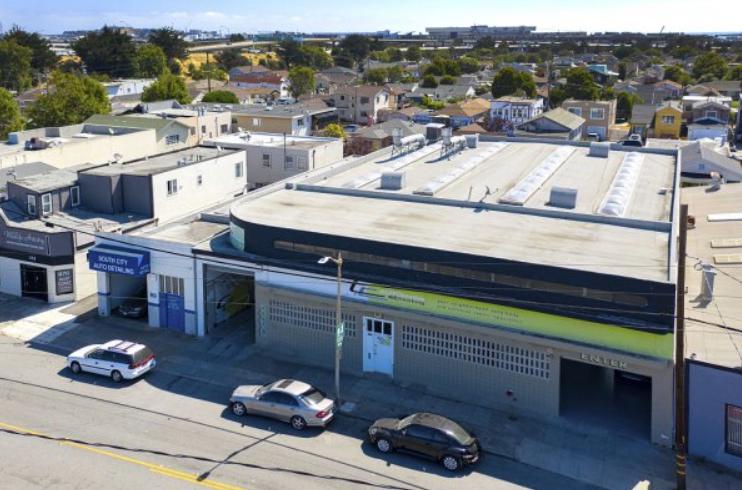
1-Mile | 3-Miles | 5-Miles | ||
---|---|---|---|---|
Total Population | 16,101 | 125,199 | 246,289 | |
Population Median Age | 38 | 40 | 41 | |
Population by Age | 0-9 Yrs | 1793 (11%) | 12759 (10%) | 25190 (10%) |
10-19 Yrs | 1707 (10%) | 13244 (10%) | 26217 (10%) | |
20-29 Yrs | 2462 (15%) | 16625 (13%) | 31408 (12%) | |
30-39 Yrs | 2899 (18%) | 19769 (15%) | 37557 (15%) | |
40-49 Yrs | 2153 (13%) | 16932 (13%) | 34496 (14%) | |
50-59 Yrs | 2284 (14%) | 17505 (13%) | 35093 (14%) | |
60-69 Yrs | 1563 (9%) | 14976 (11%) | 29680 (12%) | |
70+ Yrs | 1240 (7%) | 13390 (10%) | 26648 (10%) | |
Median HH Income | $102,110 | $109,122 | $113,146 | |
Total Household Income | < 24K | 538 (10%) | 4131 (9%) | 7723 (9%) |
25-49K | 727 (13%) | 4767 (11%) | 9249 (11%) | |
50-74K | 631 (11%) | 4663 (11%) | 9533 (11%) | |
75-99K | 712 (13%) | 5649 (13%) | 10439 (12%) | |
100-199K | 1820 (34%) | 14095 (33%) | 28062 (33%) | |
200K+ | 889 (16%) | 8436 (20%) | 18400 (22%) | |
Highest Education Level | No Diploma | 1695 | 11140 | 17999 |
Diploma or GED | 2149 | 17166 | 31383 | |
Some College | 2354 | 18025 | 35584 | |
Assoc. Degree | 1226 | 8111 | 15312 | |
Bachelors Degree | 2948 | 25635 | 54127 | |
Higher Degree | 1171 | 11739 | 27204 | |
Total Housing Units | 5,547 | 43,453 | 86,823 | |
--Owner-Occupied | 2,675 | 24,493 | 50,036 | |
--Renter-Occupied | 2,642 | 17,248 | 33,369 | |
Owner-Occupied Values | < 100K | 47 | 512 | 970 |
100-199K | 4 | 205 | 502 | |
200-299K | 27 | 181 | 458 | |
300-399K | 100 | 434 | 884 | |
400-499K | 182 | 691 | 1467 | |
500K+ | 2315 | 22470 | 45754 | |
Total Working Age Population | 13,220 | 104,611 | 205,409 | |
In Work Force | 9,786 | 72,473 | 142,124 | |
Not In Work Force | 3,434 | 32,138 | 63,285 | |
Workforce Employed | 9,255 | 69,825 | 136,805 | |
Workforce Unemployed | 519 | 2,543 | 5,155 | |
Civlian Workforce | 9,774 | 72,367 | 141,960 | |
Military Workforce | 12 | 105 | 164 | |
Total Households | 5,317 | 41,741 | 83,405 | |
Family Households | 3,626 | 29,956 | 59,014 | |
Non-Family Households | 1,691 | 11,785 | 24,391 | |
Married Couple | 2,557 | 22,626 | 44,787 | |
Other Family | 1,070 | 7,330 | 14,227 | |
Married w/Child | 1,107 | 9,377 | 18,338 | |
Single Male w/Child | 63 | 690 | 1,318 | |
Single Female w/Child | 279 | 1,929 | 3,648 |
Population Change Last Two Decades - Plus Projection
2000 | % | 2010 | % | 2020 | % | 2030 | |
---|---|---|---|---|---|---|---|
California | 33,871,648 | +10 | 37,253,956 | +9 | 40,467,295 | +8 | 43,631,295 |
Alameda County | 1,443,741 | +5 | 1,510,271 | +12 | 1,696,752 | +10 | 1,861,027 |
San Francisco County | 776,733 | +4 | 805,235 | +12 | 903,294 | +8 | 976,481 |
San Mateo County | 707,161 | +2 | 718,451 | +9 | 785,650 | +6 | 833,868 |
Total Working Age Population:
Total Households:
Total Working Age Population:
Total Households:
Total Working Age Population:
Total Households: