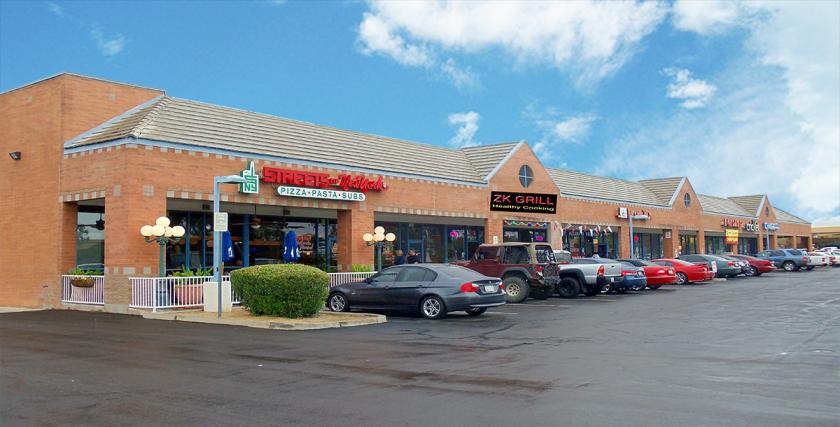
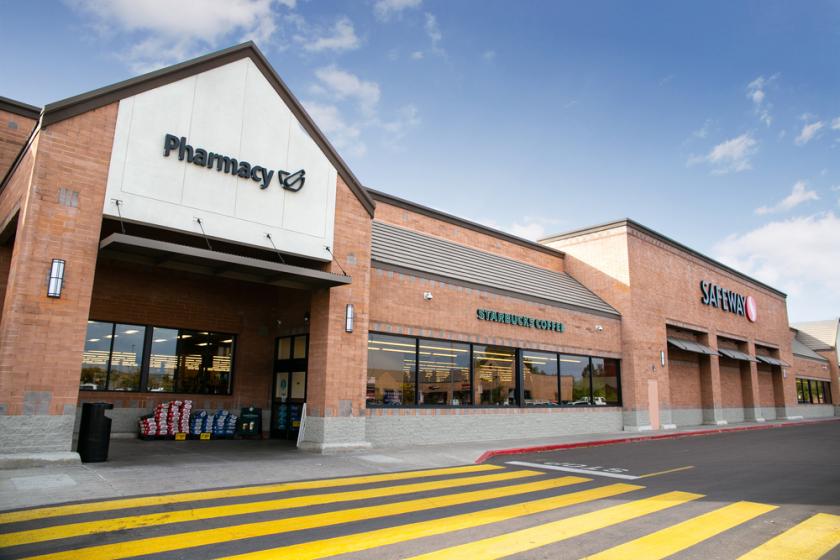
1-Mile | 3-Miles | 5-Miles | ||
---|---|---|---|---|
Total Population | 12,824 | 120,068 | 240,168 | |
Population Median Age | 43 | 40 | 41 | |
Population by Age | 0-9 Yrs | 1353 (10%) | 13931 (11%) | 26597 (11%) |
10-19 Yrs | 1462 (11%) | 13877 (11%) | 27423 (11%) | |
20-29 Yrs | 985 (7%) | 14213 (11%) | 28978 (12%) | |
30-39 Yrs | 1583 (12%) | 18728 (15%) | 34749 (14%) | |
40-49 Yrs | 1752 (13%) | 15629 (13%) | 30819 (12%) | |
50-59 Yrs | 2081 (16%) | 16658 (13%) | 34545 (14%) | |
60-69 Yrs | 2132 (16%) | 14598 (12%) | 29626 (12%) | |
70+ Yrs | 1476 (11%) | 12434 (10%) | 27431 (11%) | |
Median HH Income | $94,208 | $72,780 | $74,739 | |
Total Household Income | < 24K | 395 (8%) | 6414 (13%) | 13652 (13%) |
25-49K | 665 (13%) | 9527 (20%) | 19081 (19%) | |
50-74K | 762 (15%) | 8230 (17%) | 16195 (16%) | |
75-99K | 750 (15%) | 6874 (14%) | 13588 (13%) | |
100-199K | 1589 (33%) | 12036 (25%) | 24001 (24%) | |
200K+ | 635 (13%) | 3914 (8%) | 11017 (11%) | |
Highest Education Level | No Diploma | 287 | 7276 | 13403 |
Diploma or GED | 1555 | 15524 | 30297 | |
Some College | 2019 | 19085 | 38858 | |
Assoc. Degree | 1085 | 7342 | 14218 | |
Bachelors Degree | 2870 | 23306 | 47191 | |
Higher Degree | 1819 | 13596 | 29640 | |
Total Housing Units | 5,184 | 51,007 | 107,703 | |
--Owner-Occupied | 3,997 | 29,164 | 61,095 | |
--Renter-Occupied | 798 | 17,831 | 36,440 | |
Owner-Occupied Values | < 100K | 64 | 1576 | 4347 |
100-199K | 164 | 3282 | 7220 | |
200-299K | 375 | 7095 | 13927 | |
300-399K | 1565 | 7211 | 12848 | |
400-499K | 1094 | 4866 | 8140 | |
500K+ | 735 | 5134 | 14612 | |
Total Working Age Population | 10,713 | 97,673 | 196,758 | |
In Work Force | 6,981 | 66,139 | 132,598 | |
Not In Work Force | 3,732 | 31,534 | 64,159 | |
Workforce Employed | 6,768 | 63,557 | 127,618 | |
Workforce Unemployed | 214 | 2,574 | 4,965 | |
Civlian Workforce | 6,981 | 66,131 | 132,583 | |
Military Workforce | 0 | 8 | 15 | |
Total Households | 4,795 | 46,995 | 97,535 | |
Family Households | 3,637 | 29,606 | 59,939 | |
Non-Family Households | 1,158 | 17,389 | 37,596 | |
Married Couple | 3,131 | 22,268 | 45,711 | |
Other Family | 505 | 7,339 | 14,228 | |
Married w/Child | 1,085 | 8,724 | 17,173 | |
Single Male w/Child | 120 | 1,219 | 2,349 | |
Single Female w/Child | 138 | 2,288 | 4,557 |
Population Change Last Two Decades - Plus Projection
2000 | % | 2010 | % | 2020 | % | 2030 | |
---|---|---|---|---|---|---|---|
Arizona | 5,130,632 | +25 | 6,392,017 | +14 | 7,286,100 | +14 | 8,284,900 |
Maricopa County | 3,072,149 | +24 | 3,817,117 | +16 | 4,436,900 | +15 | 5,107,700 |
Total Working Age Population:
Total Households:
Total Working Age Population:
Total Households:
Total Working Age Population:
Total Households: