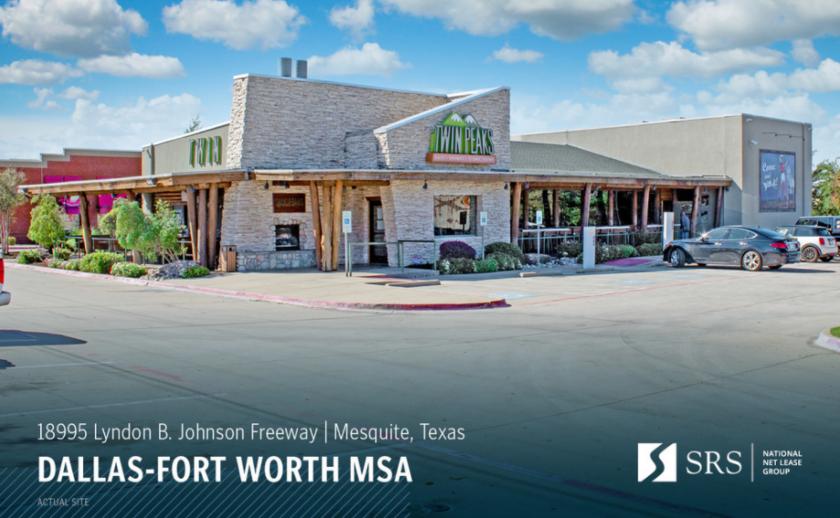
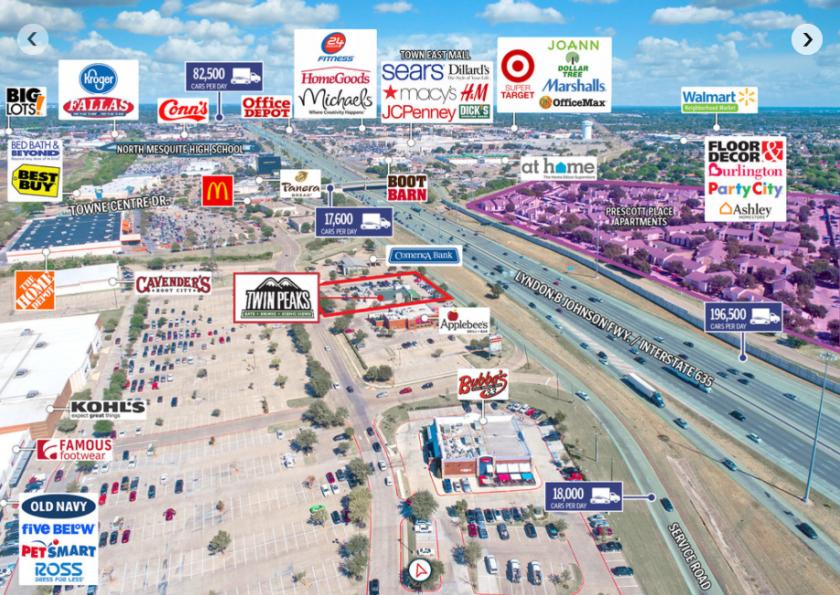
SRS National Net Lease Group is pleased to offer the opportunity to acquire the an absolute NNN, freestanding, Twin Peaks (ground lease - land ownership) investment property located in Mesquite, Texas (Dallas MSA). The tenant, Twin Restaurant, LP, has approximately 2.5 years remaining in their initial term with 2 (5-year) options to extend. Twin Restaurant, LP exercised 2 (5-year) options in 2013 and recently in 2018, demonstrating their commitment to the site. The ground lease features a 10% rental increase at the beginning of each option period, growing NOI and hedging against inflation. The ground lease is corporate guaranteed and is absolute NNN with zero landlord responsibilities making it an ideal, management-free investment opportunity for an out of state investor.Twin Peaks is strategically situated just off Interstate 635 / Lyndon B Johnson Freeway (196,500 VPD) with excellent highway frontage and a large pylon sign, increasing visibility to the subject property. The asset is also an outparcel within The Marketplace at Town Centre, a Kohl’s, Ross Dress for Less, Old Navy, Five Below, and Famous Footwear anchored shopping center, promoting crossover shopping to the site. Other nearby national/credit tenants include JCPenney, Dillard’s, Macy’s, Target, Dick’s Sporting Goods, The Home Depot, Best Buy, Bed Bath & Beyond, Burlington, and more, increasing consumer traffic to the trade area. In addition, Twin Peaks is within close proximity to a number of apartment complexes, including Prescott Place, Falltree Apartments (126 units), Mesquite Village Apartments (264 units), The Barons Apartments (508 units), Parc East Apartments (209 units), and more, providing a direct consumer base to draw from. The 5-mile trade area is supported by nearly 330,000 residents with an average household income of $68,000.