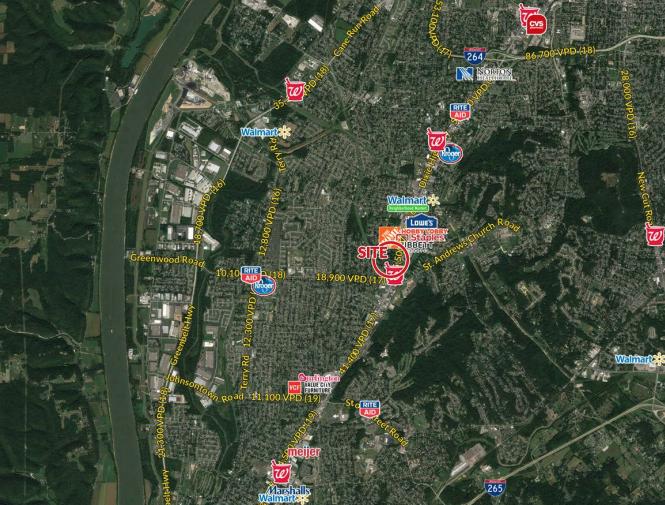
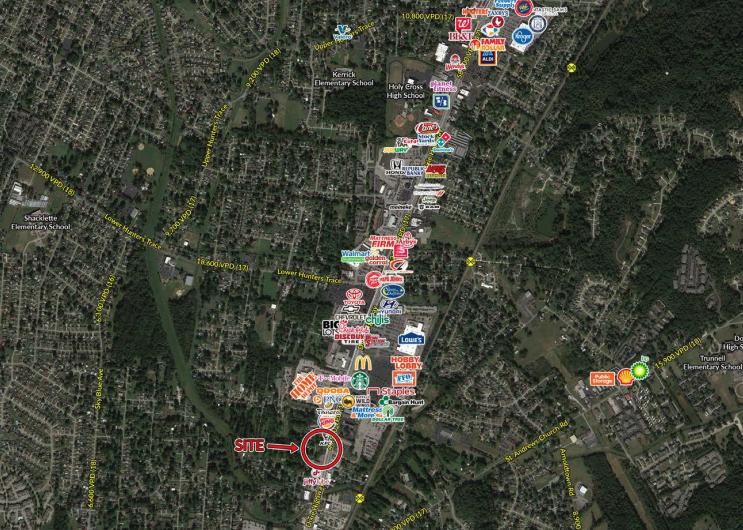
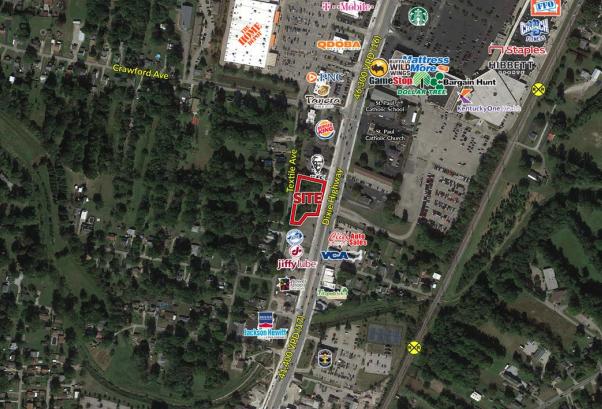
1-Mile | 3-Miles | 5-Miles | ||
---|---|---|---|---|
Total Population | 7,483 | 73,577 | 165,071 | |
Population Median Age | 42 | 40 | 38 | |
Population by Age | 0-9 Yrs | 723 (9%) | 8855 (12%) | 22028 (13%) |
10-19 Yrs | 675 (9%) | 9121 (12%) | 20633 (12%) | |
20-29 Yrs | 1125 (15%) | 10000 (13%) | 22729 (13%) | |
30-39 Yrs | 655 (8%) | 8905 (12%) | 21327 (12%) | |
40-49 Yrs | 1260 (16%) | 8551 (11%) | 20005 (12%) | |
50-59 Yrs | 1104 (14%) | 10230 (13%) | 22866 (13%) | |
60-69 Yrs | 1289 (17%) | 9743 (13%) | 19750 (11%) | |
70+ Yrs | 653 (8%) | 8172 (11%) | 15733 (9%) | |
Median HH Income | $51,500 | $52,666 | $47,185 | |
Total Household Income | < 24K | 696 (21%) | 5849 (20%) | 15755 (24%) |
25-49K | 848 (26%) | 8030 (27%) | 18002 (28%) | |
50-74K | 606 (19%) | 5669 (19%) | 11808 (18%) | |
75-99K | 423 (13%) | 4190 (14%) | 8556 (13%) | |
100-199K | 493 (15%) | 4731 (16%) | 9006 (14%) | |
200K+ | 102 (3%) | 689 (2%) | 1097 (1%) | |
Highest Education Level | No Diploma | 788 | 6211 | 15991 |
Diploma or GED | 2184 | 18975 | 41527 | |
Some College | 1419 | 12643 | 27035 | |
Assoc. Degree | 309 | 4680 | 10086 | |
Bachelors Degree | 590 | 5419 | 11564 | |
Higher Degree | 299 | 3091 | 5880 | |
Total Housing Units | 3,420 | 31,890 | 71,583 | |
--Owner-Occupied | 1,993 | 19,596 | 40,086 | |
--Renter-Occupied | 1,174 | 9,561 | 24,137 | |
Owner-Occupied Values | < 100K | 473 | 4074 | 11976 |
100-199K | 1207 | 12284 | 23143 | |
200-299K | 199 | 2197 | 3548 | |
300-399K | 60 | 508 | 697 | |
400-499K | 32 | 254 | 291 | |
500K+ | 21 | 279 | 431 | |
Total Working Age Population | 6,340 | 59,284 | 130,168 | |
In Work Force | 4,001 | 37,693 | 82,784 | |
Not In Work Force | 2,339 | 21,591 | 47,385 | |
Workforce Employed | 3,844 | 35,500 | 77,013 | |
Workforce Unemployed | 156 | 2,131 | 5,659 | |
Civlian Workforce | 4,000 | 37,631 | 82,672 | |
Military Workforce | 1 | 62 | 111 | |
Total Households | 3,167 | 29,157 | 64,224 | |
Family Households | 1,824 | 18,806 | 40,657 | |
Non-Family Households | 1,344 | 10,351 | 23,566 | |
Married Couple | 1,369 | 12,299 | 24,929 | |
Other Family | 455 | 6,507 | 15,728 | |
Married w/Child | 422 | 4,180 | 8,792 | |
Single Male w/Child | 29 | 755 | 1,596 | |
Single Female w/Child | 170 | 2,740 | 6,559 |
Population Change Last Two Decades - Plus Projection
2000 | % | 2010 | % | 2020 | % | 2030 | |
---|---|---|---|---|---|---|---|
Indiana | 6,080,485 | +7 | 6,483,802 | +4 | 6,738,573 | +4 | 7,014,880 |
Floyd County | 70,823 | +5 | 74,578 | +6 | 78,826 | +3 | 81,345 |
Harrison County | 34,325 | +15 | 39,364 | +3 | 40,636 | +6 | 43,157 |
Kentucky | 4,041,769 | +7 | 4,339,367 | +4 | 4,533,464 | +4 | 4,726,382 |
Bullitt County | 61,236 | +21 | 74,319 | +12 | 83,186 | +10 | 91,527 |
Jefferson County | 693,604 | +7 | 741,096 | +7 | 790,010 | +6 | 837,477 |
Total Working Age Population:
Total Households:
Total Working Age Population:
Total Households:
Total Working Age Population:
Total Households: