Retail Space
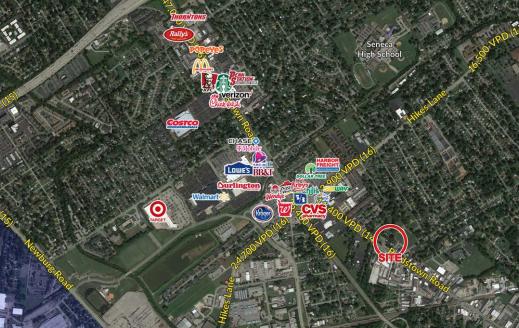
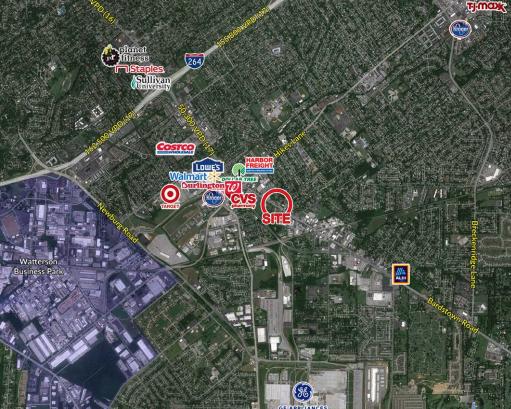
3819 Bardstown Road Louisville, KY 40218
3819 Bardstown Road Louisville, KY 40218

Details & Description
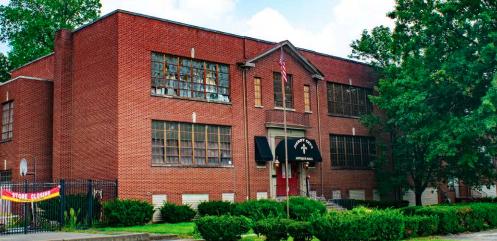
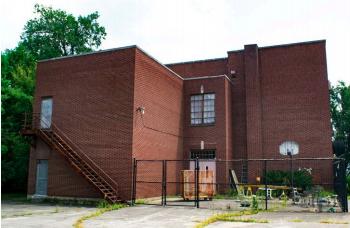
Additional Photos

Listing Agents

Ashley McCarty
O: 502-271-5815
amccarty@hogandev.com
O: 502-271-5815
amccarty@hogandev.com
While we strive to provide the most accurate information, all listing information, and demographic data, is provided by third-parties. As such, MyEListing will not be responsible for the accuracy of the information. It is strongly recommended that you verify all information with the listing agent, and any relevant agencies, prior to making any decisions.