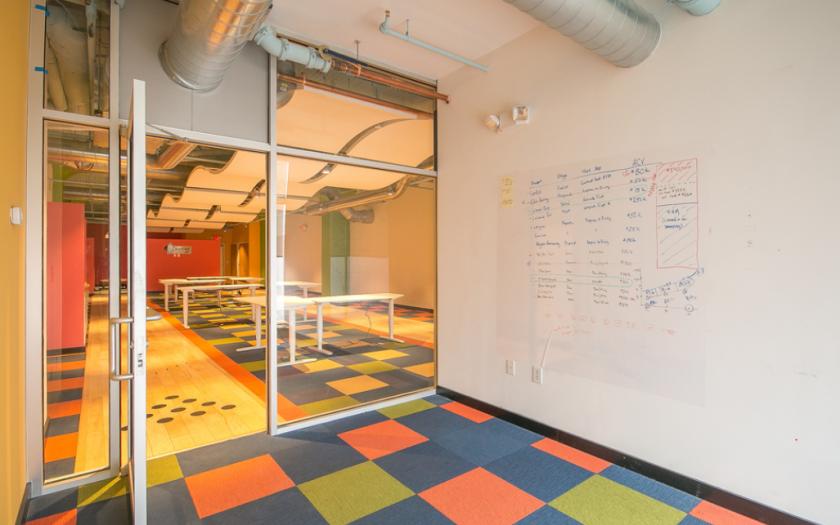
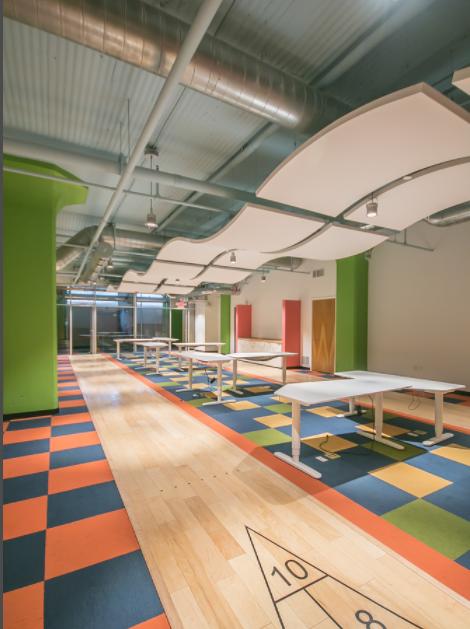
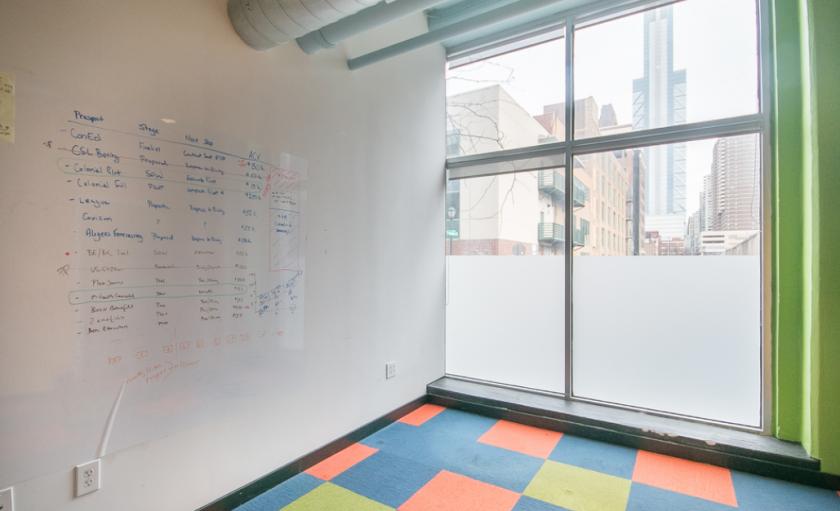
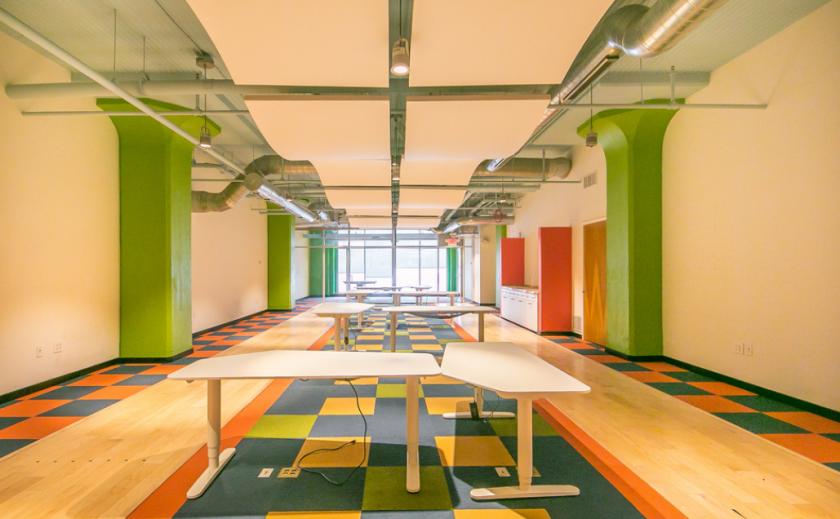
2200 Arch Street is a 2,449 SF first-floor office condominium in Philadelphia’s Logan Square neighborhood. The 12-story building in which this condo situated was completely redeveloped in 2006 into luxury condominiums and offices, and was renamed 2200 Arch. The building is sits at the southwest corner of 22nd & Arch streets, with Arch Street to the north, Cuthbert Street to the South, 22nd Street to the East, and 23rd Street to the West. Unit 125, the subject of this offering, is one of six commercial units in the building. While it was previously being used as a professional office space, the unit is Zoned CMX-5 and it’s uses would include an office for an accountant, dentist, lawyer, doctor, architect, tech firm, marketing firm, etc The unit will be delivered vacant at settlement. At the front entrance to the building, there is a secured doorway with security desk and elevators to the residential condominiums above. Unit 125 is on the main floor of the building, which it shares with four other professional offices, a community conference room, a fitness center, access to a loading dock, and shared men’s and women’s bathrooms. Unit 125 has 35 feet of frontage along 22nd Street, and a private entrance. The condo includes two private offices within the space that include expansive windows that provide a view of 22nd Street and the impressively rising Comcast Center. The monthly condo fee is $1,041, which includes trash removal, snow removal, common area maintenance, window cleaning, insurance, and capital reserves. 2200 Arch is located in the Logan Square neighborhood and is ideal for a business. It has easy accessto the Schuylkill Expressway, the Vine Street Expressway, 30th Street Station, the Center City Business District, City Hall, and the nearby public transportation system of SEPTA, including Regional Rail Lines, buses, and the Market-Frankford and Broad Street subway lines.