Health Care and Medical Properties
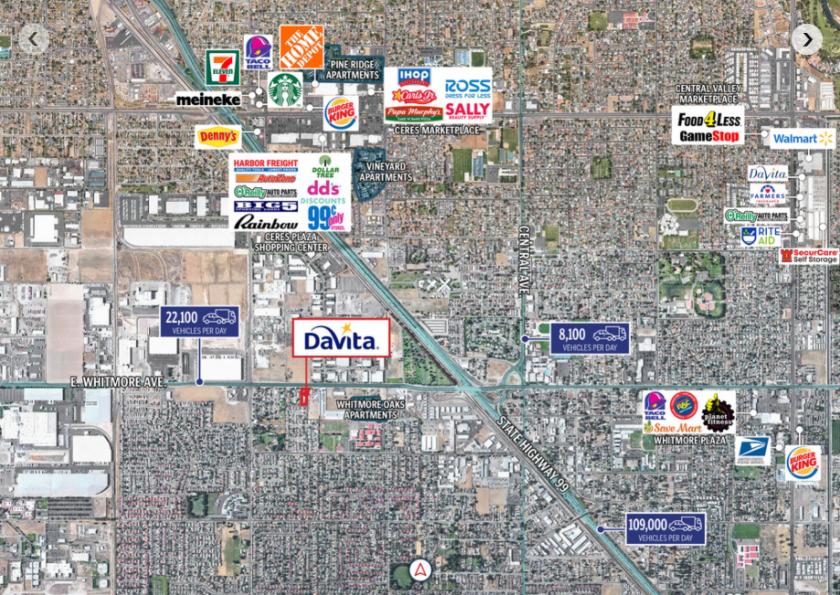
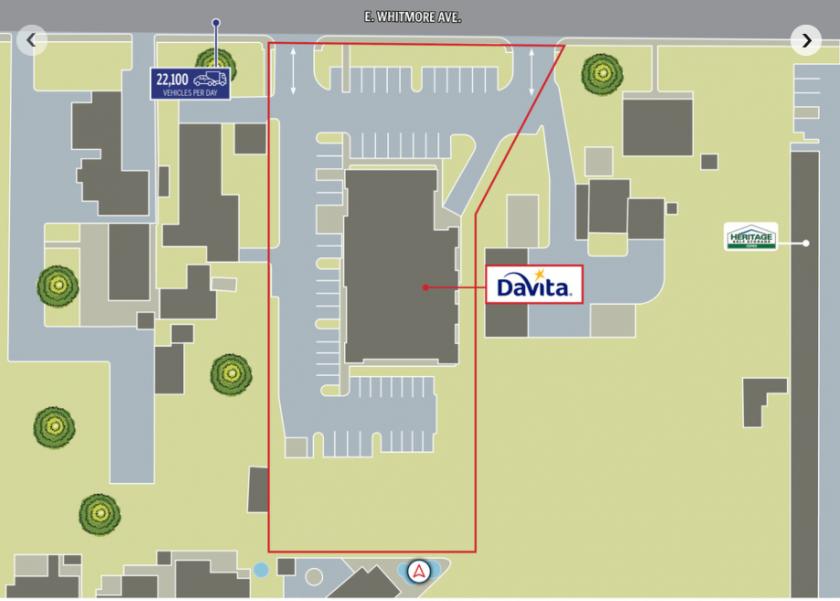
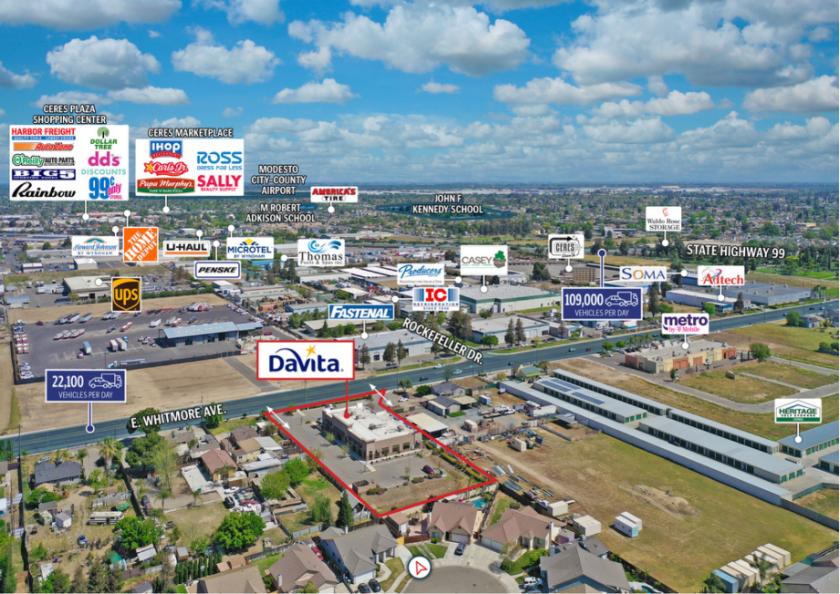
1424 East Whitmore Avenue Ceres, CA 95307
1424 East Whitmore Avenue Ceres, CA 95307
Details & Description
Property Highlights
- • Two Property Portfolio
- • 1424 East Whitmore Avenue Ceres, California 95307
- • 1781 Santa Clara Drive Roseville, California 95661
Listing Agents

Matthew Mousavi
O: 949-698-1116
M: 714-404-8849
matthew.mousavi@srsre.com
O: 949-698-1116
M: 714-404-8849
matthew.mousavi@srsre.com
While we strive to provide the most accurate information, all listing information, and demographic data, is provided by third-parties. As such, MyEListing will not be responsible for the accuracy of the information. It is strongly recommended that you verify all information with the listing agent, and any relevant agencies, prior to making any decisions.