Industrial Properties
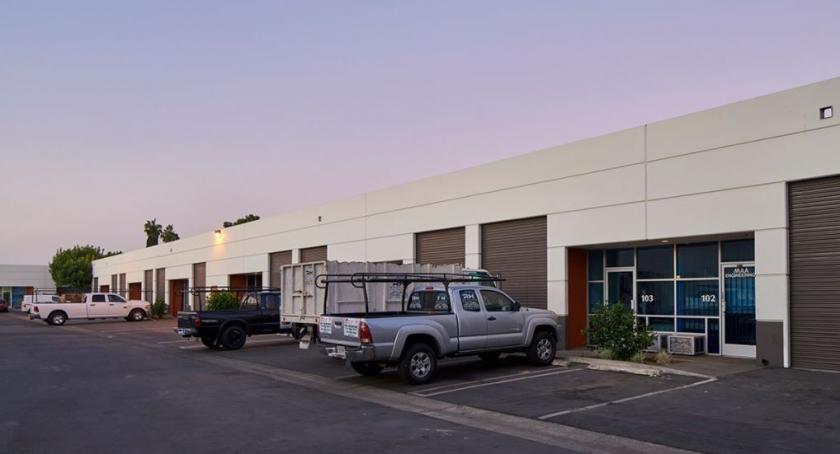
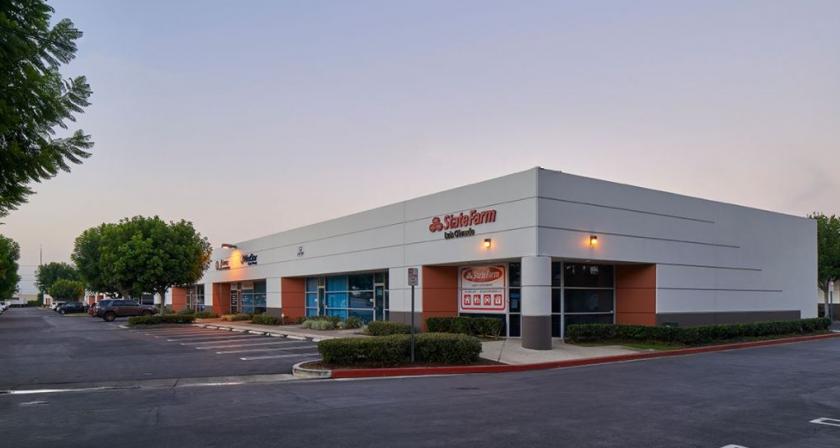
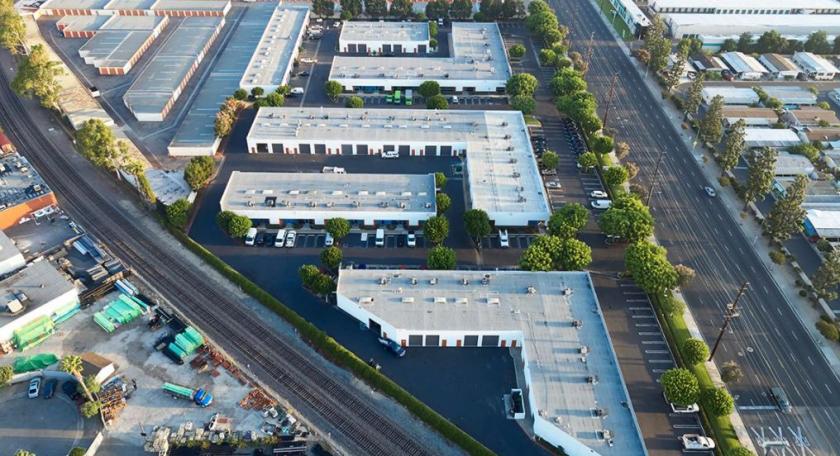
Grand Commerce Center Santa Ana, CA 92705
Grand Commerce Center Santa Ana, CA 92705
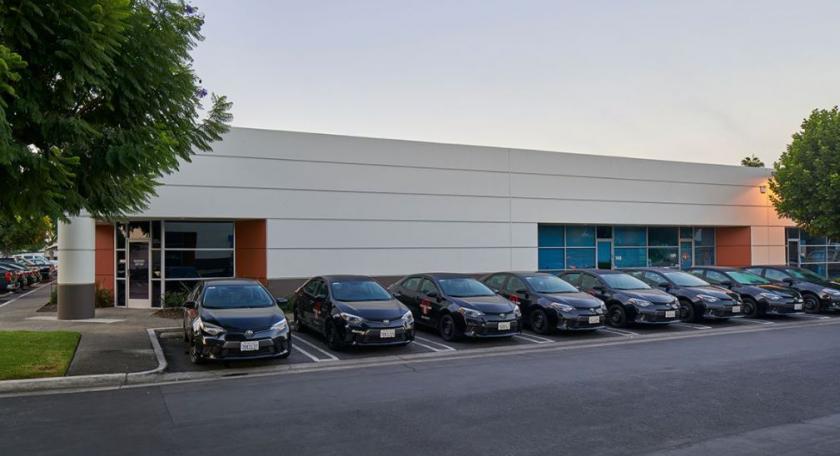
Details & Description
Additional Photos
Listing Agents

Rexford Industrial
Rexford Industrial
O: 858-333-8453
contact@rexfordindustrial.com
Rexford Industrial
O: 858-333-8453
contact@rexfordindustrial.com
While we strive to provide the most accurate information, all listing information, and demographic data, is provided by third-parties. As such, MyEListing will not be responsible for the accuracy of the information. It is strongly recommended that you verify all information with the listing agent, and any relevant agencies, prior to making any decisions.


