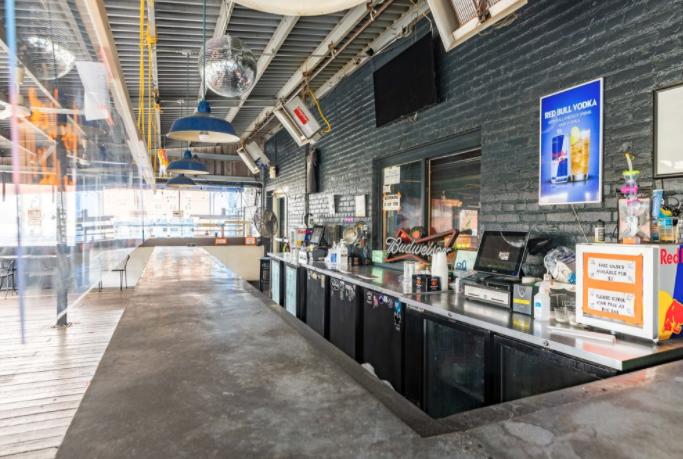
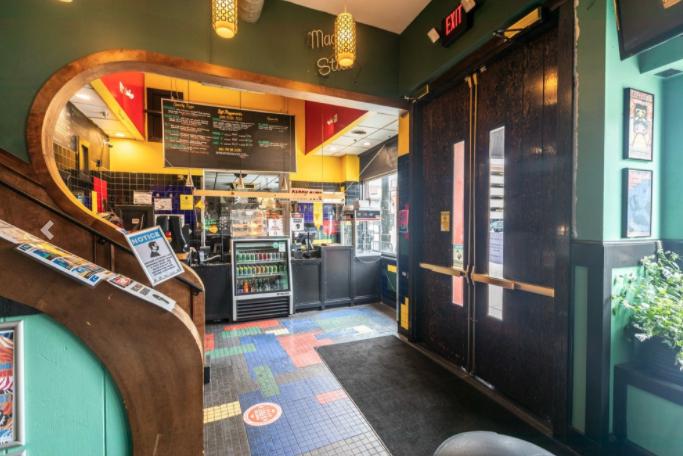
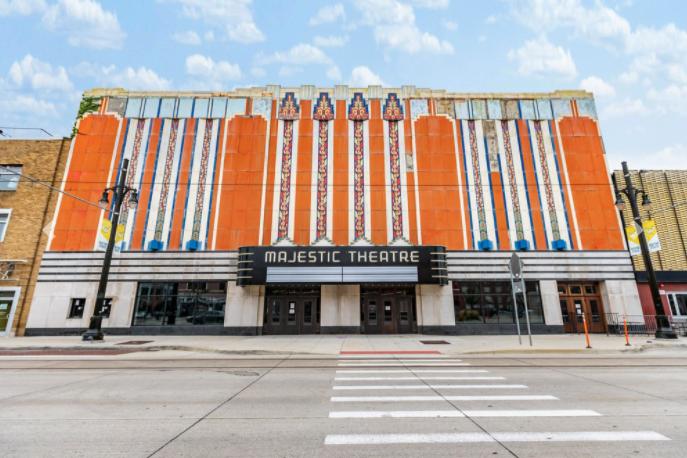
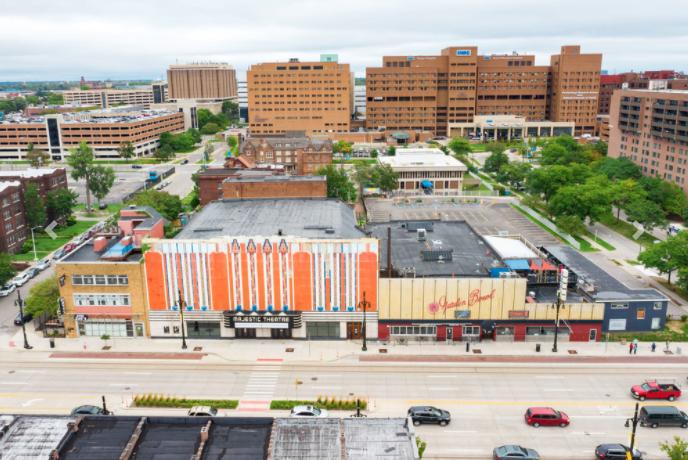
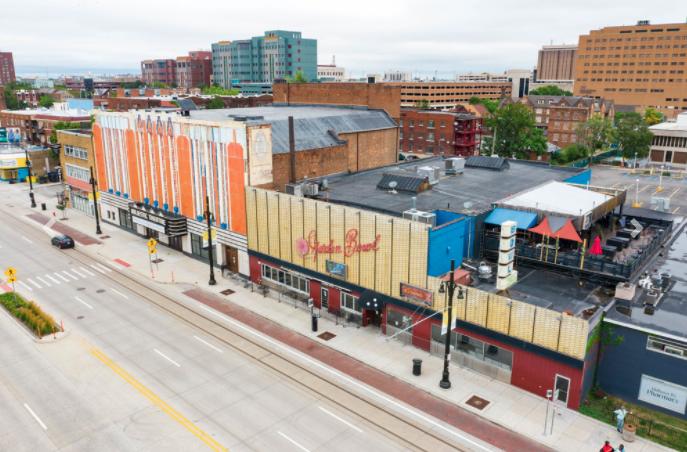
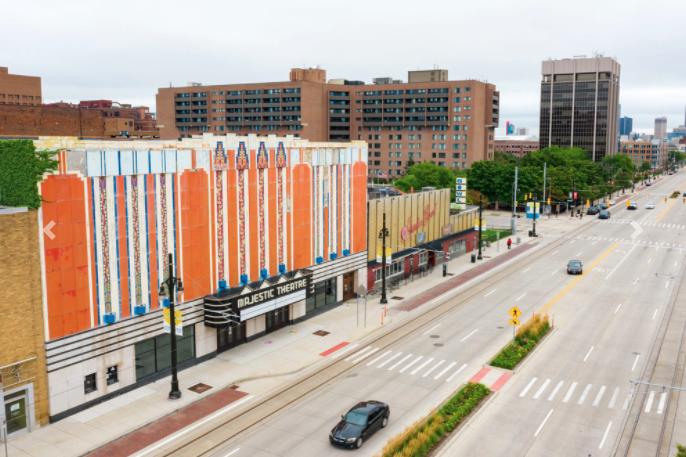
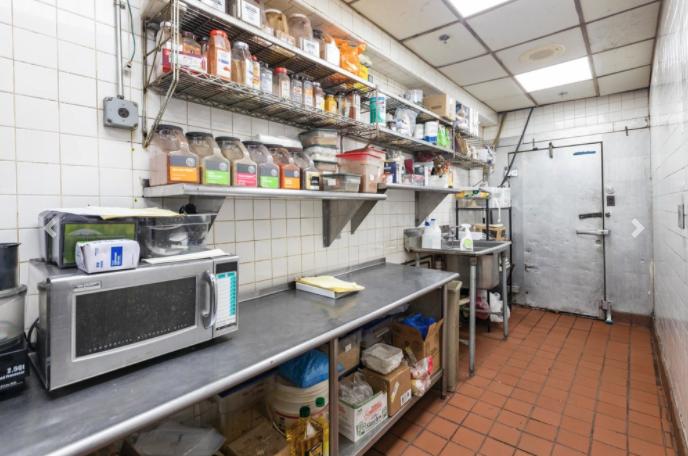
Retail Space
4138 Woodward Avenue, 4100-4138 Detroit, MI 48201
4138 Woodward Avenue, 4100-4138 Detroit, MI 48201
Details & Description
Property Highlights
• Contact Agents for More Information
• Contact Agents for More Information
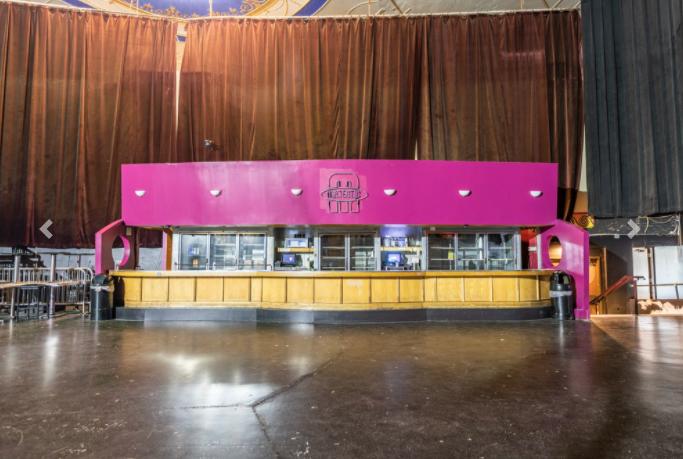
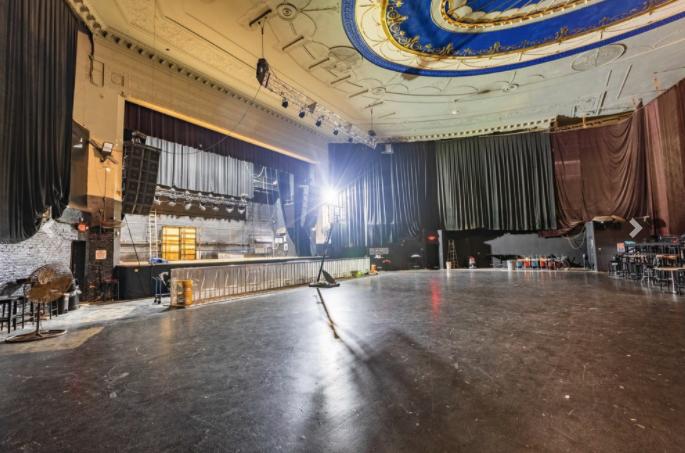
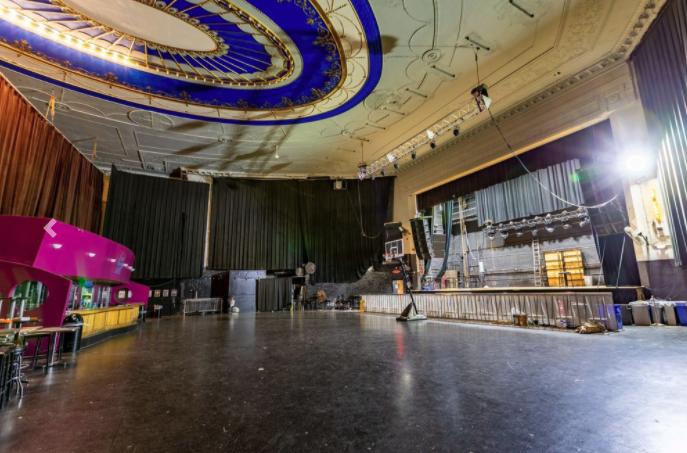
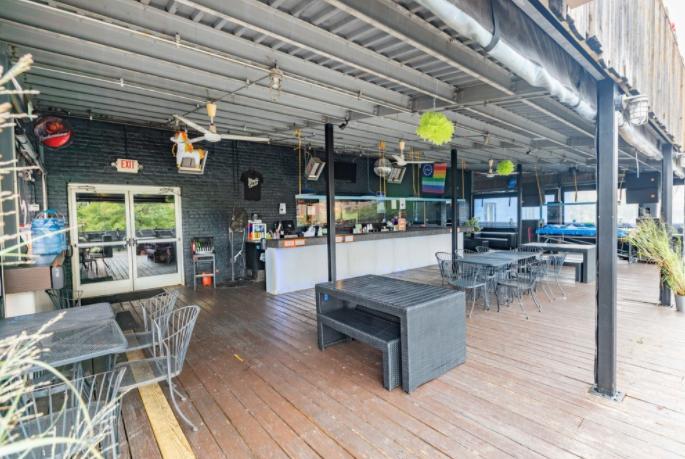
Additional Photos
Listing Agents
Daniel McCleary
O: 248-351-4384
M: 248-770-3969
mccleary@farbman.com
O: 248-351-4384
M: 248-770-3969
mccleary@farbman.com

Nathan Casey
O: 248-351-4391
M: 586-871-5155
casey@farbman.com
O: 248-351-4391
M: 586-871-5155
casey@farbman.com

Erik Lawshe
O: 248-351-6333
M: 248-933-4001
lawshe@farbman.com
O: 248-351-6333
M: 248-933-4001
lawshe@farbman.com
While we strive to provide the most accurate information, all listing information, and demographic data, is provided by third-parties. As such, MyEListing will not be responsible for the accuracy of the information. It is strongly recommended that you verify all information with the listing agent, and any relevant agencies, prior to making any decisions.