Commercial Land
Hwy 23 and Town Center Drive Circle Pines, MN 55014
Hwy 23 and Town Center Drive Circle Pines, MN 55014
Details & Description
Property Highlights
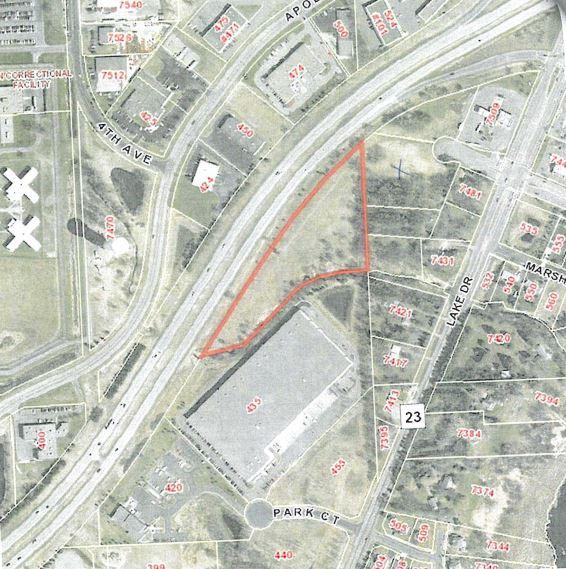
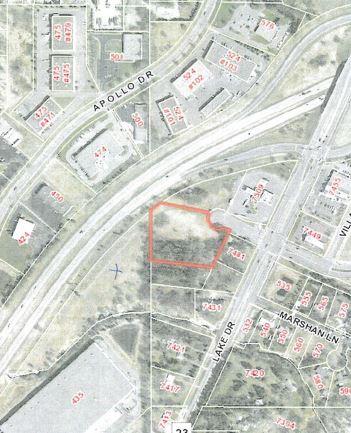
- • Government owned
- • Zoned General Business
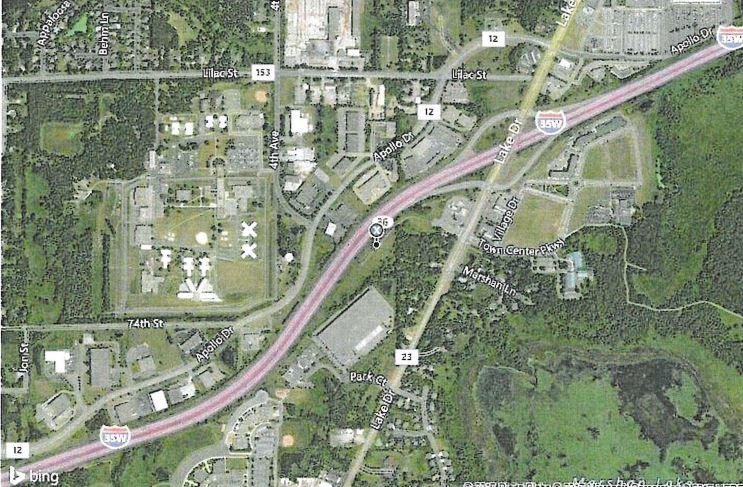
- • On 35W with access from Hwy 23
- • PIDs 17-31-22-24-0004 17-31-22-23-0002
Listing Agents

Myles Borstad
O: 763-862-2005
M: 612-270-0354
mborstad@gmail.com
O: 763-862-2005
M: 612-270-0354
mborstad@gmail.com
While we strive to provide the most accurate information, all listing information, and demographic data, is provided by third-parties. As such, MyEListing will not be responsible for the accuracy of the information. It is strongly recommended that you verify all information with the listing agent, and any relevant agencies, prior to making any decisions.