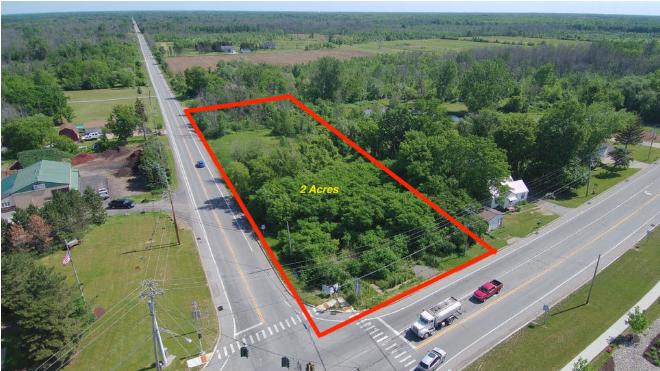
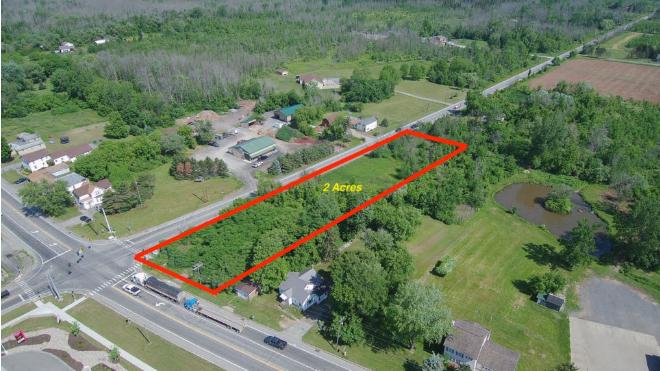
1-Mile | 3-Miles | 5-Miles | ||
---|---|---|---|---|
Total Population | 1,491 | 12,726 | 29,106 | |
Population Median Age | 40 | 38 | 38 | |
Population by Age | 0-9 Yrs | 179 (12%) | 1393 (10%) | 3013 (10%) |
10-19 Yrs | 154 (10%) | 1597 (12%) | 4639 (15%) | |
20-29 Yrs | 216 (14%) | 2479 (19%) | 5328 (18%) | |
30-39 Yrs | 178 (11%) | 1476 (11%) | 3152 (10%) | |
40-49 Yrs | 184 (12%) | 1310 (10%) | 2769 (9%) | |
50-59 Yrs | 209 (14%) | 1687 (13%) | 4084 (14%) | |
60-69 Yrs | 202 (13%) | 1505 (11%) | 3332 (11%) | |
70+ Yrs | 168 (11%) | 1278 (10%) | 2789 (9%) | |
Median HH Income | $58,705 | $57,531 | $64,111 | |
Total Household Income | < 24K | 121 (19%) | 1095 (22%) | 1936 (18%) |
25-49K | 134 (21%) | 1114 (22%) | 2223 (21%) | |
50-74K | 105 (17%) | 772 (15%) | 1653 (16%) | |
75-99K | 66 (10%) | 551 (11%) | 1206 (11%) | |
100-199K | 166 (27%) | 1212 (24%) | 2823 (27%) | |
200K+ | 18 (2%) | 170 (3%) | 396 (3%) | |
Highest Education Level | No Diploma | 51 | 404 | 881 |
Diploma or GED | 239 | 1855 | 4492 | |
Some College | 152 | 1455 | 3229 | |
Assoc. Degree | 135 | 960 | 2232 | |
Bachelors Degree | 229 | 1780 | 3812 | |
Higher Degree | 247 | 1635 | 3180 | |
Total Housing Units | 635 | 5,243 | 10,808 | |
--Owner-Occupied | 486 | 3,229 | 7,152 | |
--Renter-Occupied | 124 | 1,685 | 3,085 | |
Owner-Occupied Values | < 100K | 94 | 566 | 1152 |
100-199K | 292 | 2021 | 4301 | |
200-299K | 85 | 510 | 1352 | |
300-399K | 8 | 63 | 175 | |
400-499K | 2 | 33 | 103 | |
500K+ | 5 | 35 | 68 | |
Total Working Age Population | 1,231 | 10,416 | 24,194 | |
In Work Force | 785 | 6,673 | 15,481 | |
Not In Work Force | 446 | 3,743 | 8,713 | |
Workforce Employed | 747 | 6,312 | 14,657 | |
Workforce Unemployed | 30 | 344 | 807 | |
Civlian Workforce | 777 | 6,656 | 15,464 | |
Military Workforce | 8 | 17 | 17 | |
Total Households | 610 | 4,914 | 10,237 | |
Family Households | 394 | 2,933 | 6,549 | |
Non-Family Households | 216 | 1,981 | 3,689 | |
Married Couple | 294 | 2,258 | 5,084 | |
Other Family | 100 | 674 | 1,465 | |
Married w/Child | 110 | 895 | 1,915 | |
Single Male w/Child | 20 | 136 | 346 | |
Single Female w/Child | 34 | 240 | 491 |
Population Change Last Two Decades - Plus Projection
2000 | % | 2010 | % | 2020 | % | 2030 | |
---|---|---|---|---|---|---|---|
New York | 18,976,457 | +2 | 19,378,102 | +4 | 20,146,131 | +2 | 20,604,030 |
Monroe County | 735,343 | +1 | 744,344 | +1 | 754,529 | +1 | 758,536 |
Total Working Age Population:
Total Households:
Total Working Age Population:
Total Households:
Total Working Age Population:
Total Households: