Retail Space
2825 North Scottsdale Road Scottsdale, AZ 85257
2825 North Scottsdale Road Scottsdale, AZ 85257
Details & Description
Property Highlights
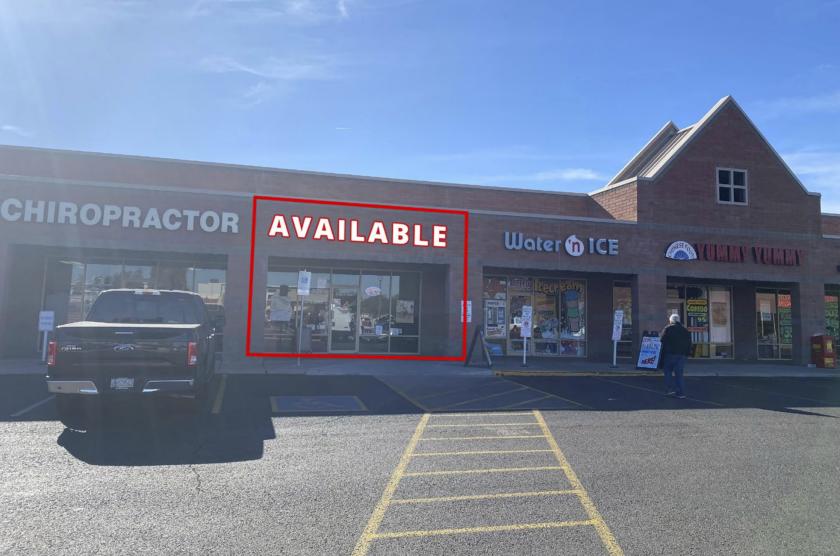
- • 2,434 SF endcap space available
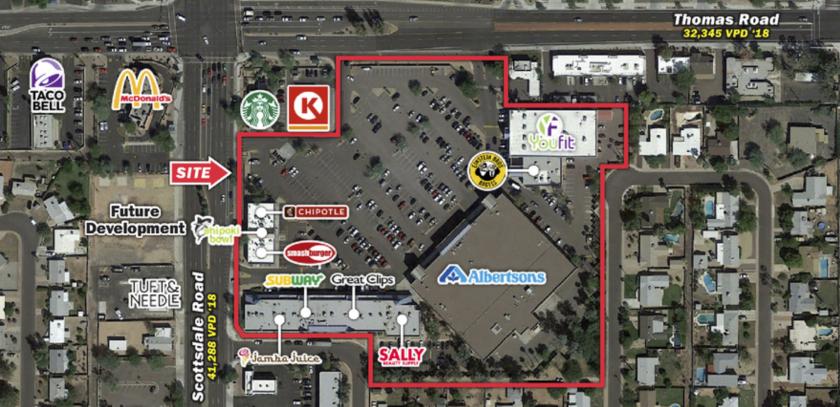
- • South Scottsdale grocery anchored center
- • Limited shops available with national co-tenancy
- • High traffic very dense demographics
Listing Agents

Sean Lieb
O: 602-491-9295
M: 602-376-9797
slieb@levrose.com
O: 602-491-9295
M: 602-376-9797
slieb@levrose.com
While we strive to provide the most accurate information, all listing information, and demographic data, is provided by third-parties. As such, MyEListing will not be responsible for the accuracy of the information. It is strongly recommended that you verify all information with the listing agent, and any relevant agencies, prior to making any decisions.