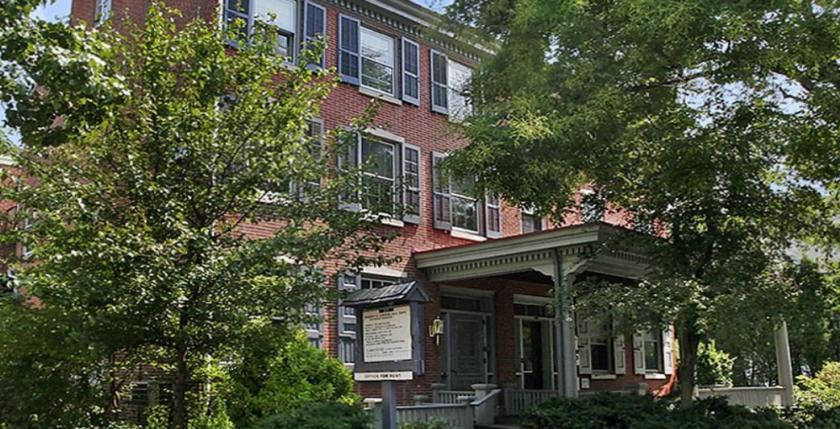
Office Space
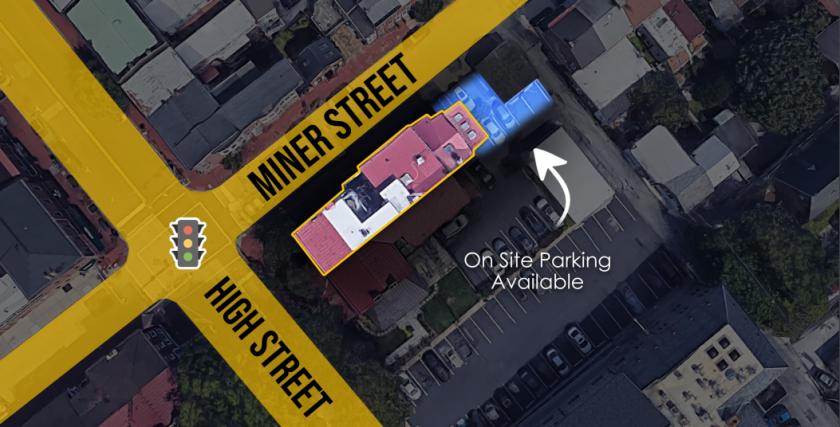
103 South High Street West Chester, PA 19382
103 South High Street West Chester, PA 19382
Details & Description
Property Highlights
• Convenience and Amenities include ALL INCLUSIVE RENT RATE On-site Parking Available Secure Building
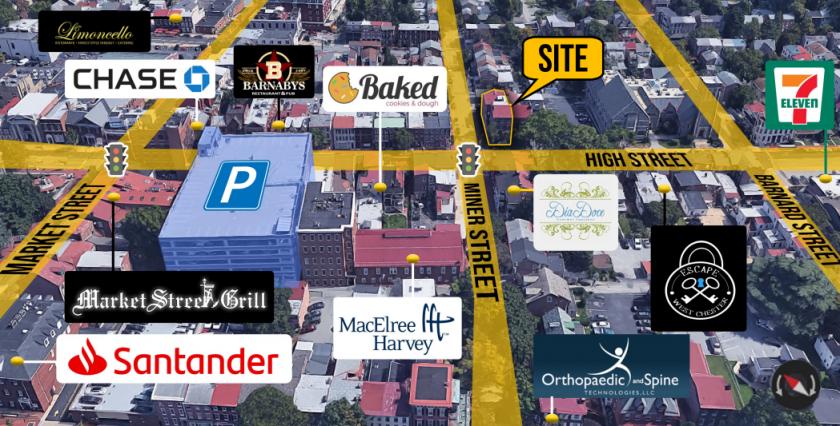
• Walking distance to over 60 restaurants and retail locations
Listing Agents

Jake Jewell
O: 484-887-8202
M: 484-310-1775
jjewell@pillarrealestateadvisors.com
O: 484-887-8202
M: 484-310-1775
jjewell@pillarrealestateadvisors.com
While we strive to provide the most accurate information, all listing information, and demographic data, is provided by third-parties. As such, MyEListing will not be responsible for the accuracy of the information. It is strongly recommended that you verify all information with the listing agent, and any relevant agencies, prior to making any decisions.