Commercial Land
4530 Ben White Blvd Austin, TX 78741
4530 Ben White Blvd Austin, TX 78741
Details & Description
Property Highlights
- • Commercial Services CS Zoning
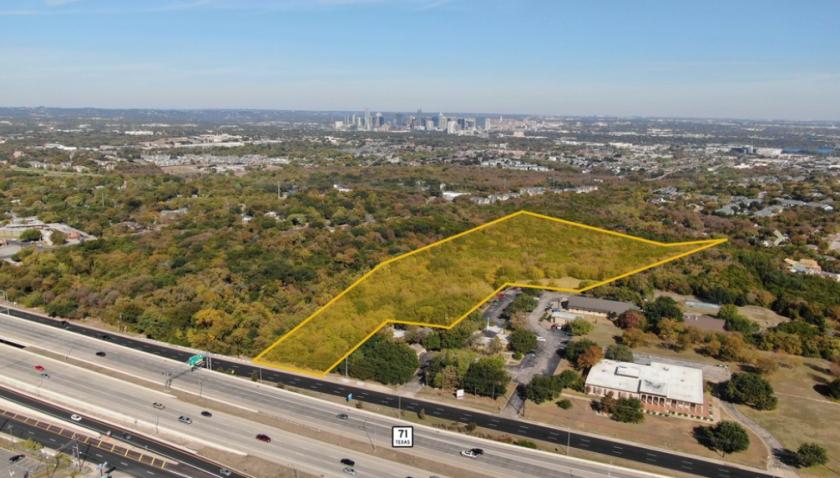
- • 121,038 VPD Along Hwy 71
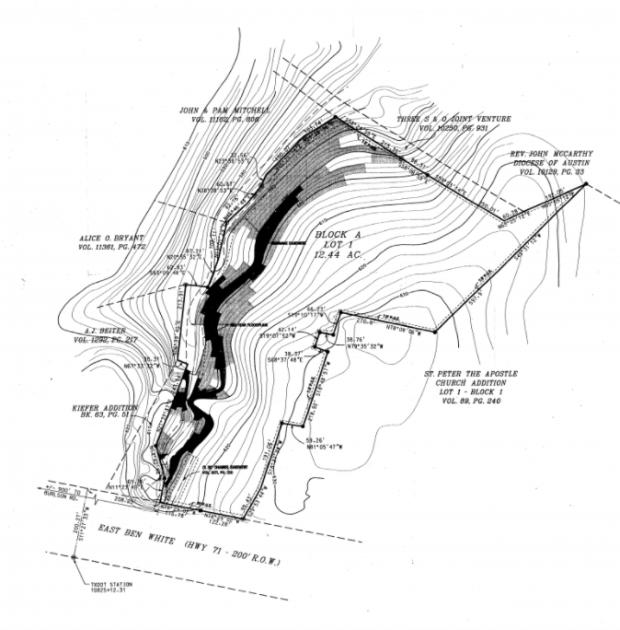
- • 245 of Frontage Along Ben White Blvd
- • Excellent Frontage Along Highway 71
- • Qualified Opportunity Zone
- • Residential Use Not Allowed
Listing Agents

Paul Byars
O: 512-694-0878
paul@sayersadvisors.com
O: 512-694-0878
paul@sayersadvisors.com
While we strive to provide the most accurate information, all listing information, and demographic data, is provided by third-parties. As such, MyEListing will not be responsible for the accuracy of the information. It is strongly recommended that you verify all information with the listing agent, and any relevant agencies, prior to making any decisions.