Commercial Land
250 Lehigh Valley Mall Fullerton, PA 18052
250 Lehigh Valley Mall Fullerton, PA 18052
Details & Description
Property Highlights
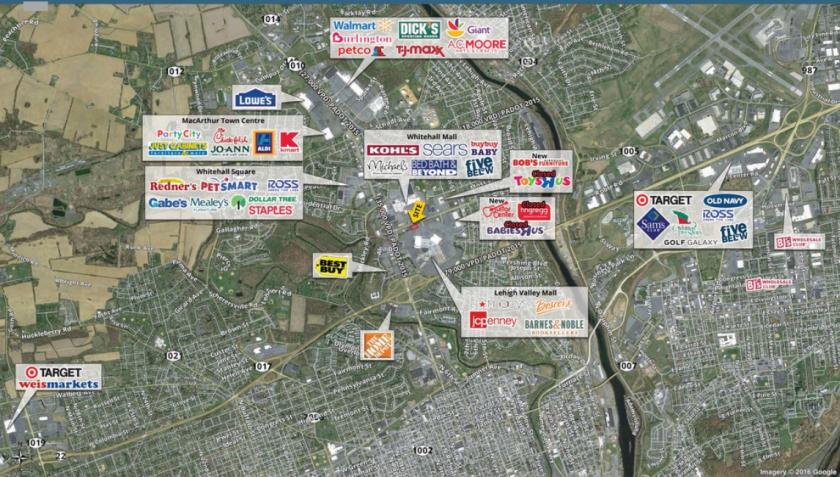
• Easy access to Rt 145 and Rt 22, Main east, west and north south corridors in the valley
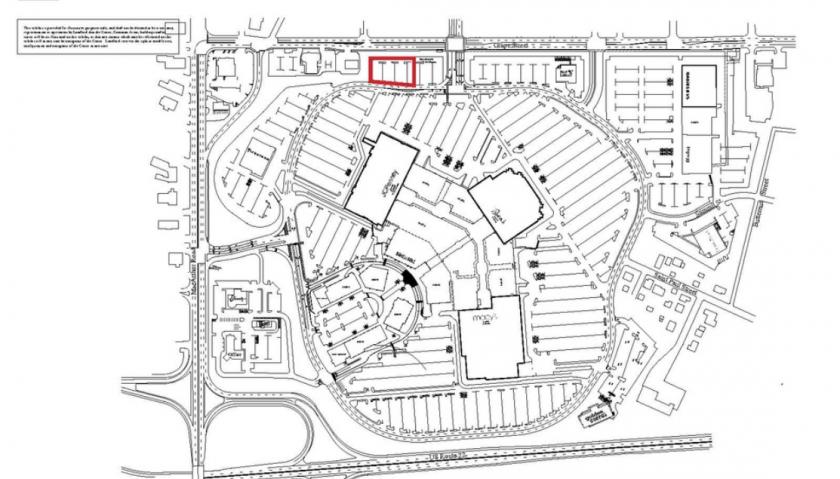
• Mall consists of 2 levels of retail totalling over 1.1 million SF
Listing Agents

David Wirth
O: 484-883-7537
david.wirth@srsre.com
O: 484-883-7537
david.wirth@srsre.com
While we strive to provide the most accurate information, all listing information, and demographic data, is provided by third-parties. As such, MyEListing will not be responsible for the accuracy of the information. It is strongly recommended that you verify all information with the listing agent, and any relevant agencies, prior to making any decisions.