Retail Space
10000 County Road 81 Maple Grove, MN 55369
10000 County Road 81 Maple Grove, MN 55369
Details & Description
Property Highlights
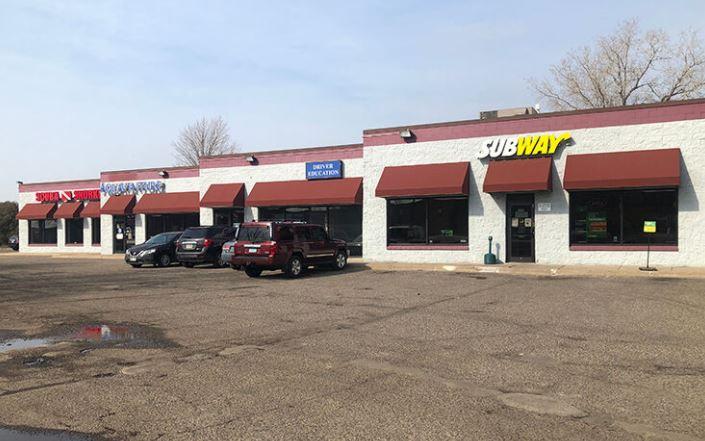
• 8,977 SF Multi-Tenant Strip Center FOR SALE in Maple Grove, MN
• Excellent visibility on County Rd 81 with high traffic counts
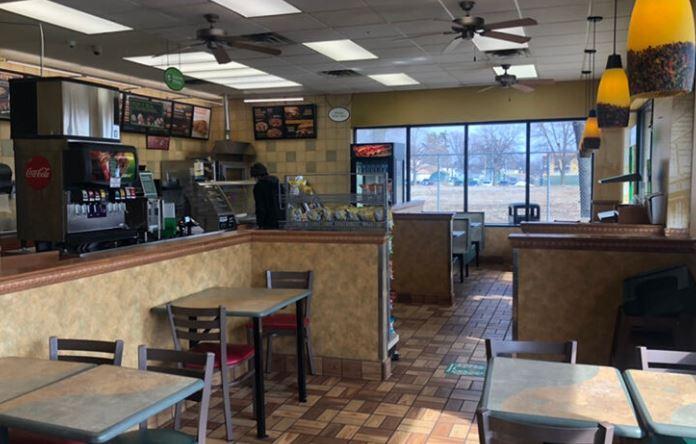
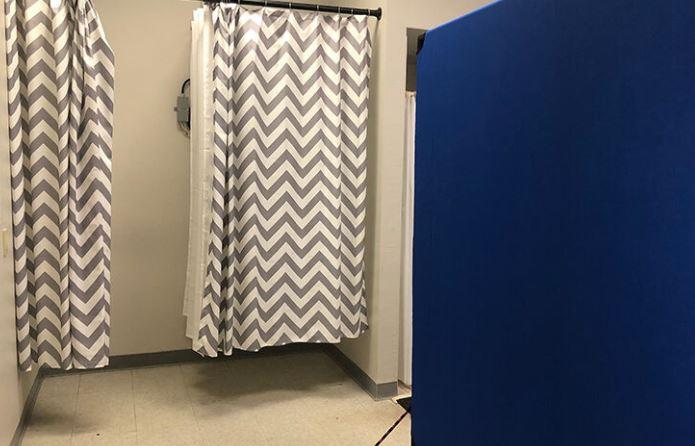
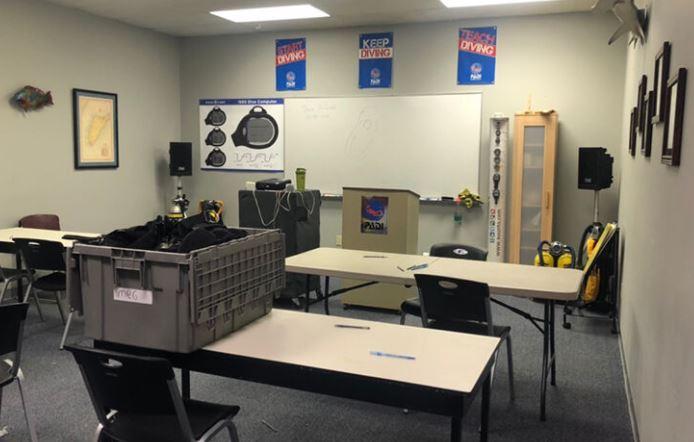
Additional Photos
Listing Agents

Chad Weeks
O: 763-424-6355
M: 612-619-9911
cweeks@arrowcos.com
O: 763-424-6355
M: 612-619-9911
cweeks@arrowcos.com
While we strive to provide the most accurate information, all listing information, and demographic data, is provided by third-parties. As such, MyEListing will not be responsible for the accuracy of the information. It is strongly recommended that you verify all information with the listing agent, and any relevant agencies, prior to making any decisions.


