Specialty Real Estate
596 Prospect Place Brooklyn, NY 11238
596 Prospect Place Brooklyn, NY 11238

Details & Description
Property Highlights
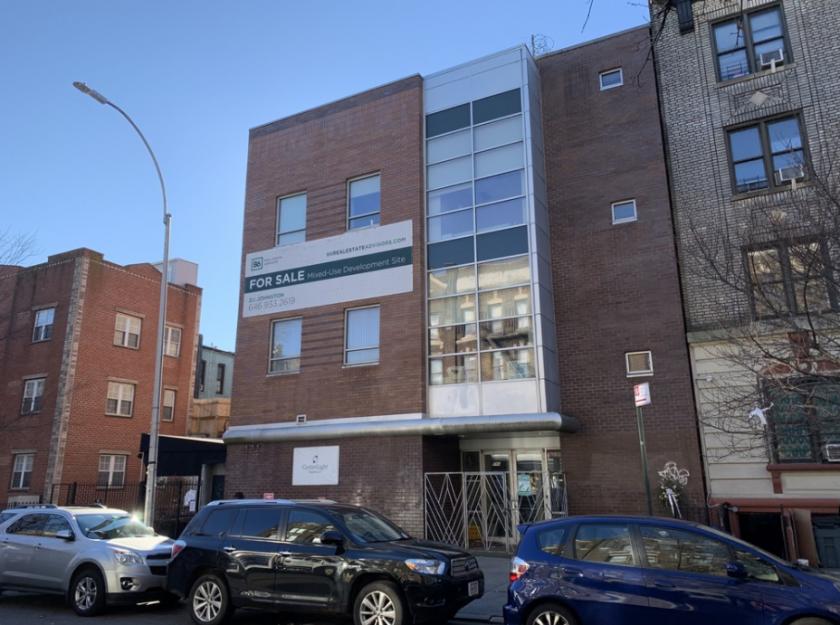
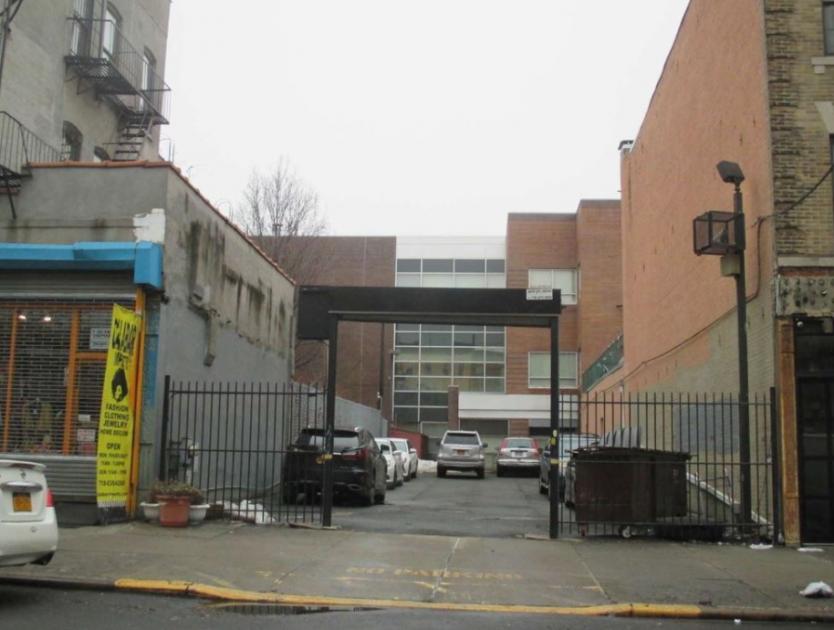
• 22,405 SF ADA building across three stories with 2 elevators, on-site parking for 15 vehicles and a large interior yard
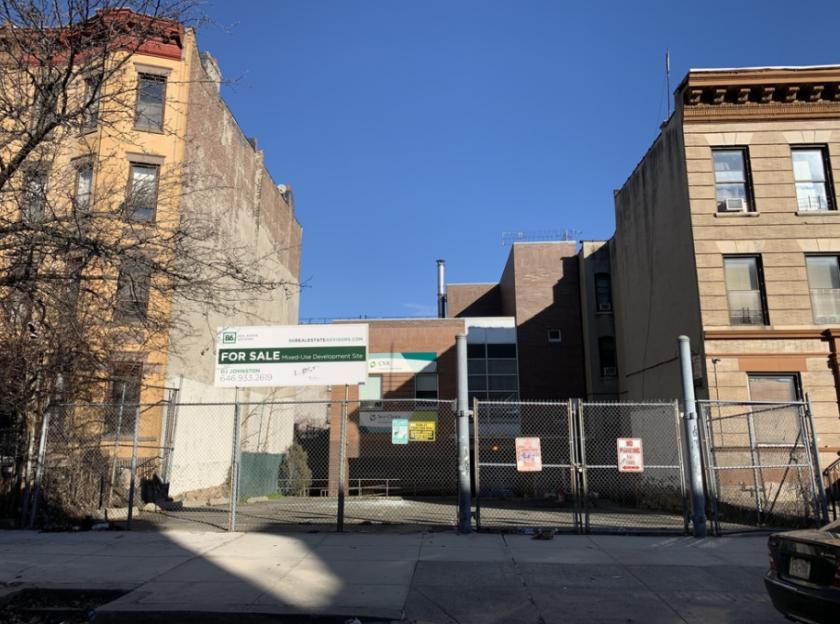
• Offers multiple frontages on Prospect Place, Franklin Avenue and Park Place.
Additional Photos

Listing Agents

William Cheng
O: 646-933-2623
wcheng@b6realestate.com
O: 646-933-2623
wcheng@b6realestate.com
While we strive to provide the most accurate information, all listing information, and demographic data, is provided by third-parties. As such, MyEListing will not be responsible for the accuracy of the information. It is strongly recommended that you verify all information with the listing agent, and any relevant agencies, prior to making any decisions.


