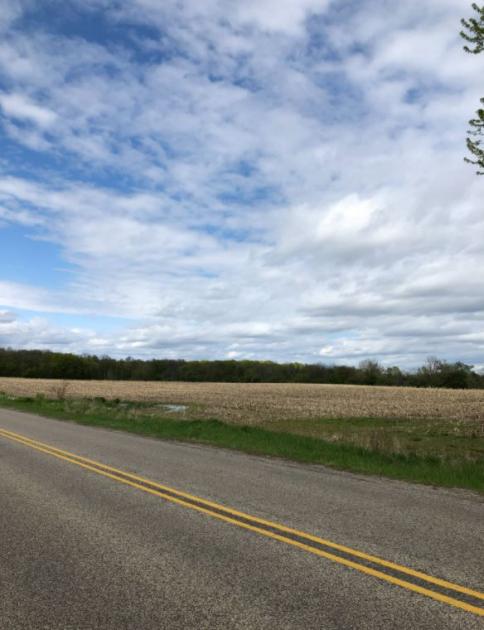
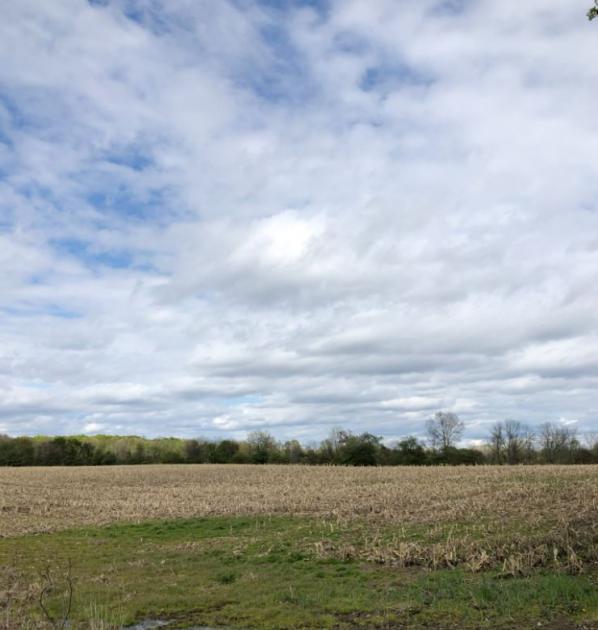
1-Mile | 3-Miles | 5-Miles | ||
---|---|---|---|---|
Total Population | 1,176 | 20,635 | 47,043 | |
Population Median Age | 44 | 42 | 42 | |
Population by Age | 0-9 Yrs | 127 (10%) | 2291 (11%) | 4744 (10%) |
10-19 Yrs | 130 (11%) | 2226 (10%) | 5092 (10%) | |
20-29 Yrs | 85 (7%) | 2467 (11%) | 6490 (13%) | |
30-39 Yrs | 172 (14%) | 3067 (14%) | 6515 (13%) | |
40-49 Yrs | 111 (9%) | 2190 (10%) | 5070 (10%) | |
50-59 Yrs | 180 (15%) | 2720 (13%) | 6452 (13%) | |
60-69 Yrs | 177 (15%) | 2960 (14%) | 6654 (14%) | |
70+ Yrs | 193 (16%) | 2714 (13%) | 6027 (12%) | |
Median HH Income | $90,207 | $68,926 | $67,648 | |
Total Household Income | < 24K | 54 (10%) | 1220 (13%) | 2740 (13%) |
25-49K | 63 (12%) | 1807 (19%) | 4503 (21%) | |
50-74K | 71 (14%) | 2063 (22%) | 4346 (20%) | |
75-99K | 105 (20%) | 1627 (17%) | 3509 (16%) | |
100-199K | 169 (33%) | 2077 (22%) | 4757 (22%) | |
200K+ | 42 (8%) | 442 (4%) | 967 (4%) | |
Highest Education Level | No Diploma | 42 | 534 | 1306 |
Diploma or GED | 152 | 3071 | 7414 | |
Some College | 208 | 3341 | 8402 | |
Assoc. Degree | 116 | 1859 | 4097 | |
Bachelors Degree | 218 | 3747 | 8166 | |
Higher Degree | 150 | 2463 | 4850 | |
Total Housing Units | 517 | 9,598 | 21,886 | |
--Owner-Occupied | 458 | 6,079 | 13,708 | |
--Renter-Occupied | 46 | 3,156 | 7,114 | |
Owner-Occupied Values | < 100K | 25 | 710 | 1938 |
100-199K | 199 | 3131 | 7053 | |
200-299K | 202 | 1758 | 3537 | |
300-399K | 19 | 365 | 856 | |
400-499K | 13 | 94 | 209 | |
500K+ | 0 | 21 | 114 | |
Total Working Age Population | 976 | 16,929 | 39,271 | |
In Work Force | 570 | 10,795 | 25,559 | |
Not In Work Force | 406 | 6,134 | 13,713 | |
Workforce Employed | 559 | 10,426 | 24,435 | |
Workforce Unemployed | 11 | 358 | 1,101 | |
Civlian Workforce | 570 | 10,783 | 25,536 | |
Military Workforce | 0 | 11 | 22 | |
Total Households | 504 | 9,235 | 20,821 | |
Family Households | 337 | 5,531 | 12,280 | |
Non-Family Households | 167 | 3,704 | 8,542 | |
Married Couple | 320 | 4,496 | 9,688 | |
Other Family | 17 | 1,035 | 2,592 | |
Married w/Child | 139 | 1,616 | 3,343 | |
Single Male w/Child | 5 | 181 | 468 | |
Single Female w/Child | 3 | 433 | 984 |
Population Change Last Two Decades - Plus Projection
2000 | % | 2010 | % | 2020 | % | 2030 | |
---|---|---|---|---|---|---|---|
Michigan | 9,938,444 | -1 | 9,883,640 | +1 | 10,023,423 | +4 | 10,424,510 |
Clinton County | 64,753 | +16 | 75,382 | +6 | 80,045 | +8 | 86,258 |
Eaton County | 103,655 | +4 | 107,759 | +2 | 109,760 | +4 | 114,184 |
Ingham County | 279,320 | +1 | 280,895 | +5 | 296,059 | +9 | 322,507 |
Total Working Age Population:
Total Households:
Total Working Age Population:
Total Households:
Total Working Age Population:
Total Households: