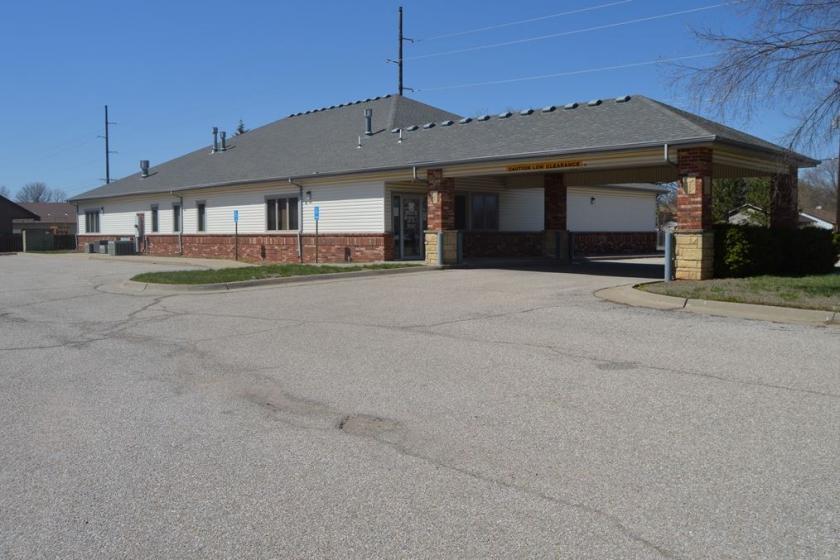
Office Space
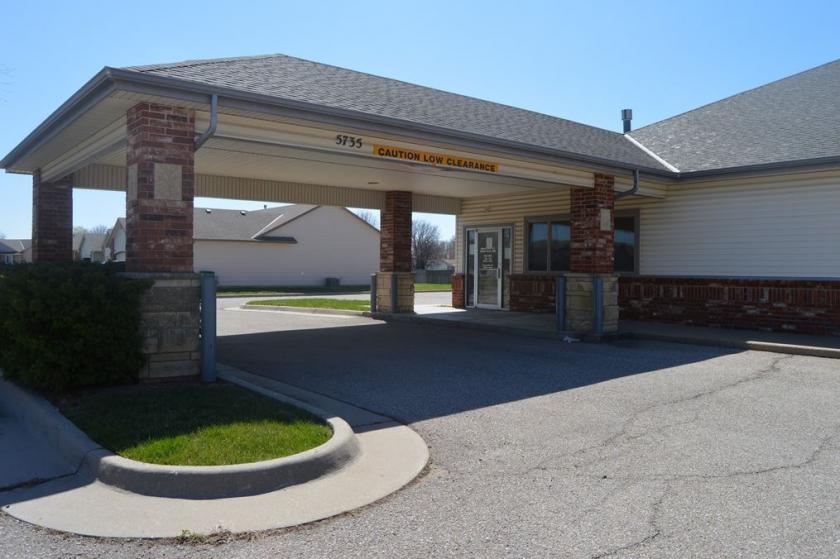
5735 West Macarthur Road Wichita, KS 67215
5735 West Macarthur Road Wichita, KS 67215
Details & Description
Property Highlights
- • Well maintained office building
- • Can be use for other type of business
- • Easy access to Highway
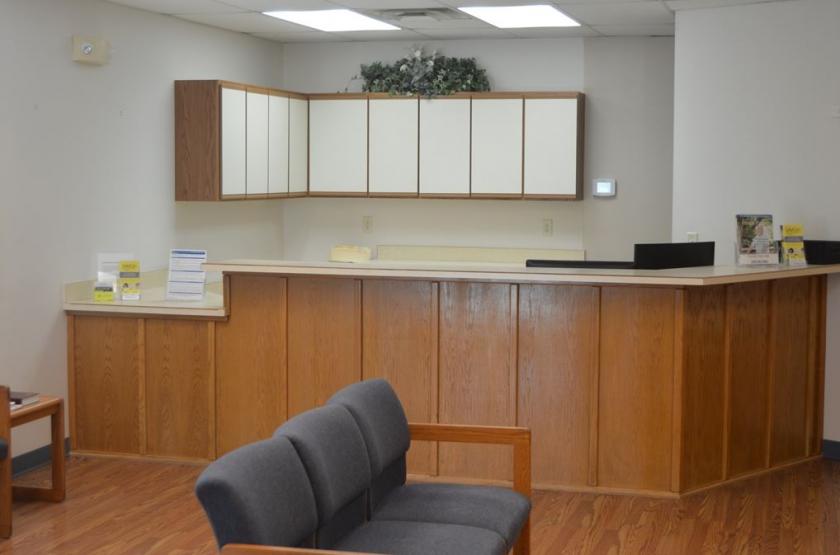
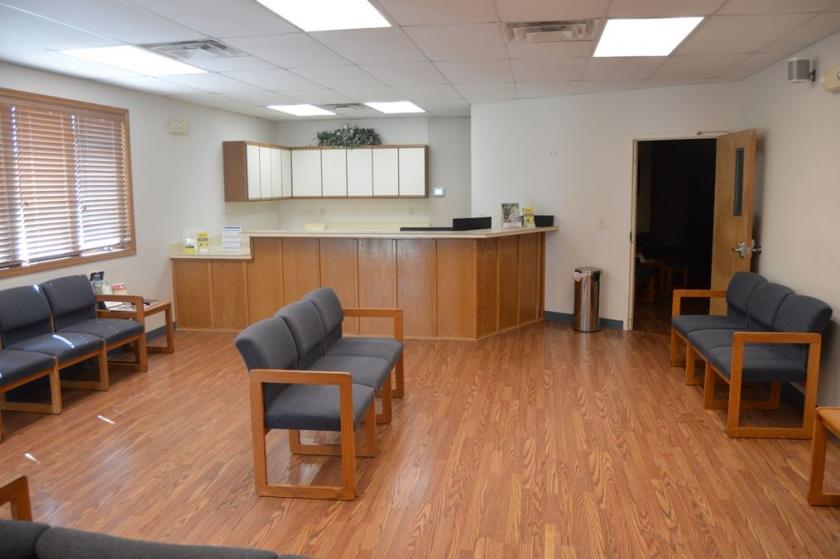
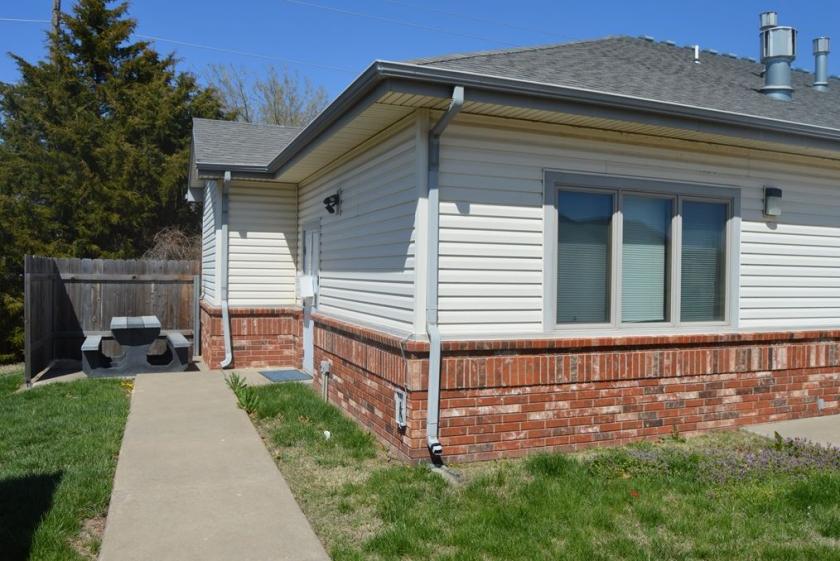
Additional Photos
Listing Agents

Dave Brown
O: 316-636-2323
M: 316-461-6297
davidb@penfedrealty.com
O: 316-636-2323
M: 316-461-6297
davidb@penfedrealty.com
While we strive to provide the most accurate information, all listing information, and demographic data, is provided by third-parties. As such, MyEListing will not be responsible for the accuracy of the information. It is strongly recommended that you verify all information with the listing agent, and any relevant agencies, prior to making any decisions.


