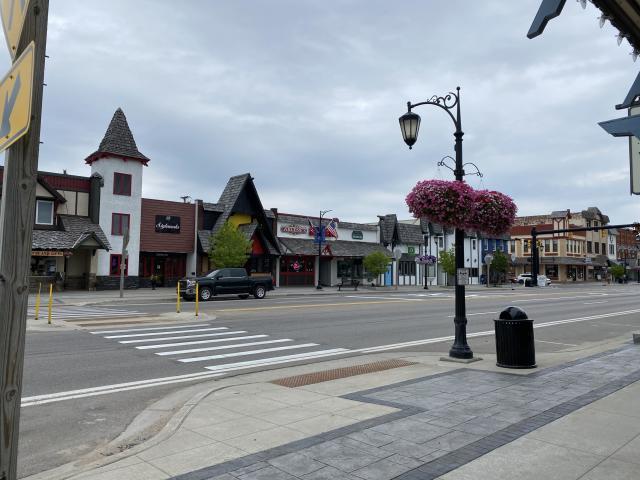
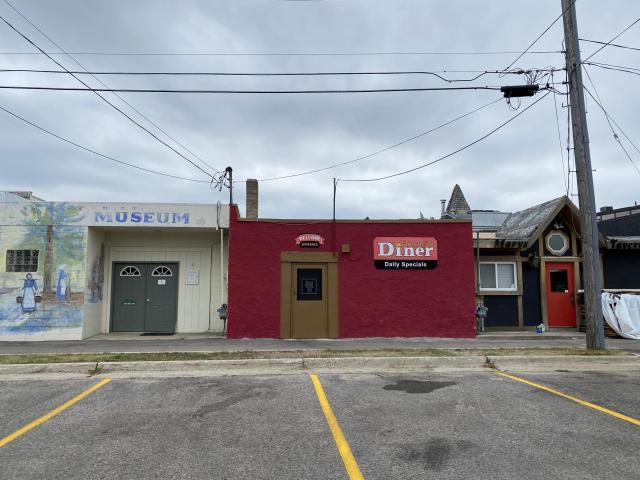
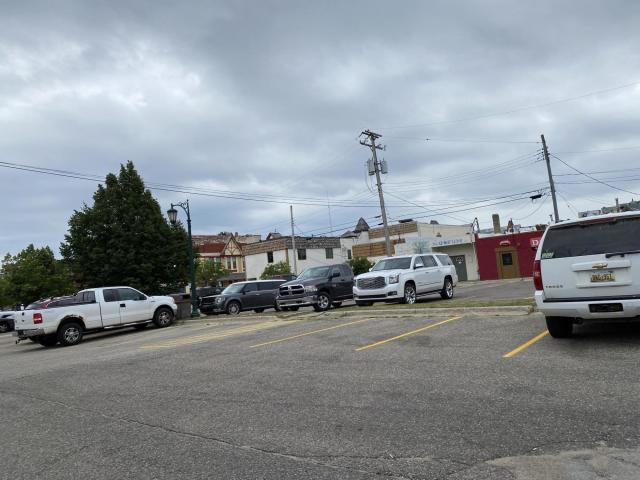
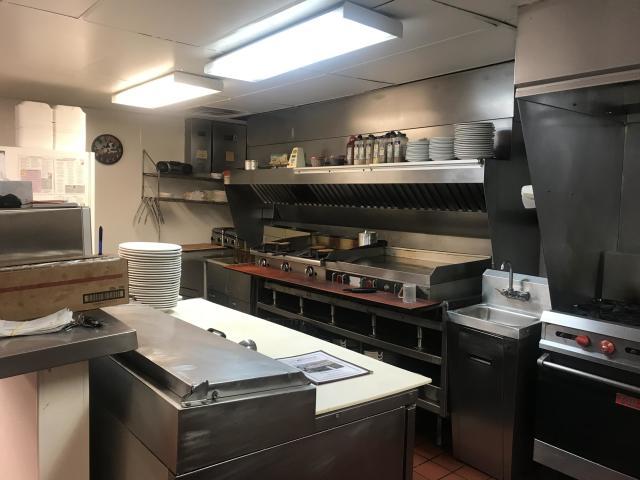
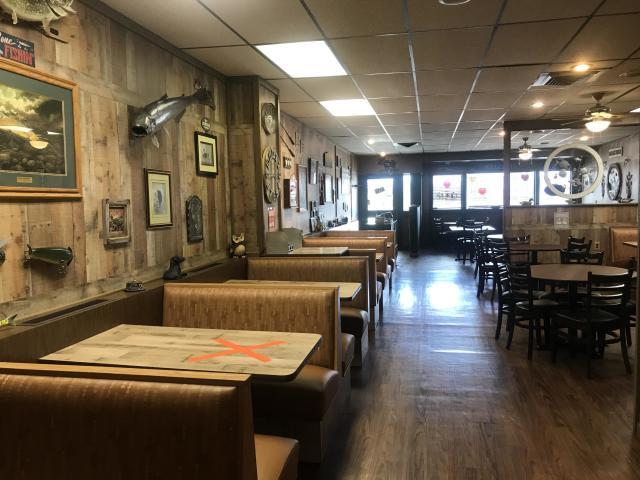
1-Mile | 3-Miles | 5-Miles | ||
---|---|---|---|---|
Total Population | 2,821 | 6,691 | 11,458 | |
Population Median Age | 39 | 41 | 42 | |
Population by Age | 0-9 Yrs | 428 (15%) | 919 (13%) | 1455 (12%) |
10-19 Yrs | 295 (10%) | 734 (10%) | 1282 (11%) | |
20-29 Yrs | 485 (17%) | 979 (14%) | 1439 (12%) | |
30-39 Yrs | 318 (11%) | 657 (9%) | 1220 (10%) | |
40-49 Yrs | 217 (7%) | 615 (9%) | 1081 (9%) | |
50-59 Yrs | 367 (13%) | 1041 (15%) | 1680 (14%) | |
60-69 Yrs | 298 (10%) | 724 (10%) | 1550 (13%) | |
70+ Yrs | 414 (14%) | 1021 (15%) | 1750 (15%) | |
Median HH Income | $39,485 | $38,584 | $48,017 | |
Total Household Income | < 24K | 351 (27%) | 794 (26%) | 1062 (21%) |
25-49K | 457 (35%) | 1028 (34%) | 1461 (30%) | |
50-74K | 202 (15%) | 448 (15%) | 979 (20%) | |
75-99K | 164 (12%) | 323 (10%) | 598 (12%) | |
100-199K | 99 (7%) | 302 (10%) | 651 (13%) | |
200K+ | 20 (1%) | 62 (2%) | 107 (2%) | |
Highest Education Level | No Diploma | 126 | 392 | 670 |
Diploma or GED | 539 | 1550 | 2509 | |
Some College | 536 | 1198 | 2044 | |
Assoc. Degree | 248 | 447 | 948 | |
Bachelors Degree | 257 | 633 | 1190 | |
Higher Degree | 100 | 289 | 639 | |
Total Housing Units | 1,378 | 3,357 | 6,372 | |
--Owner-Occupied | 647 | 1,697 | 3,395 | |
--Renter-Occupied | 646 | 1,259 | 1,464 | |
Owner-Occupied Values | < 100K | 340 | 723 | 1162 |
100-199K | 261 | 728 | 1519 | |
200-299K | 31 | 182 | 494 | |
300-399K | 1 | 31 | 113 | |
400-499K | 0 | 8 | 52 | |
500K+ | 13 | 26 | 55 | |
Total Working Age Population | 2,158 | 5,290 | 9,177 | |
In Work Force | 1,208 | 2,902 | 5,077 | |
Not In Work Force | 950 | 2,387 | 4,099 | |
Workforce Employed | 1,196 | 2,804 | 4,798 | |
Workforce Unemployed | 12 | 97 | 275 | |
Civlian Workforce | 1,208 | 2,901 | 5,073 | |
Military Workforce | 0 | 1 | 4 | |
Total Households | 1,292 | 2,956 | 4,859 | |
Family Households | 699 | 1,736 | 3,108 | |
Non-Family Households | 593 | 1,220 | 1,751 | |
Married Couple | 423 | 1,209 | 2,309 | |
Other Family | 276 | 527 | 799 | |
Married w/Child | 146 | 355 | 642 | |
Single Male w/Child | 54 | 132 | 178 | |
Single Female w/Child | 183 | 307 | 450 |
Population Change Last Two Decades - Plus Projection
2000 | % | 2010 | % | 2020 | % | 2030 | |
---|---|---|---|---|---|---|---|
Michigan | 9,938,444 | -1 | 9,883,640 | +1 | 10,023,423 | +4 | 10,424,510 |
Otsego County | 23,301 | +4 | 24,164 | +4 | 25,046 | +10 | 27,446 |
Total Working Age Population:
Total Households:
Total Working Age Population:
Total Households:
Total Working Age Population:
Total Households: