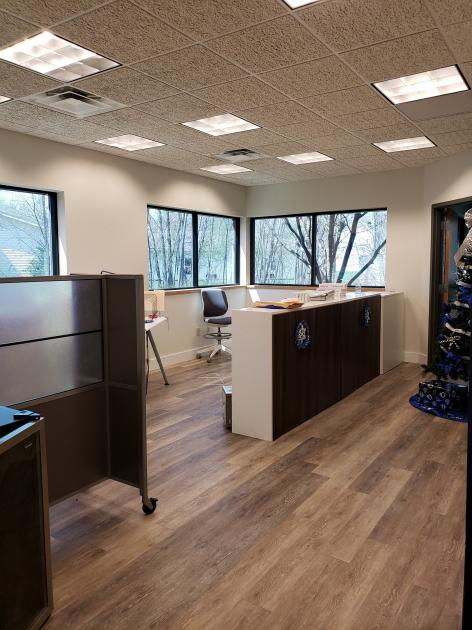
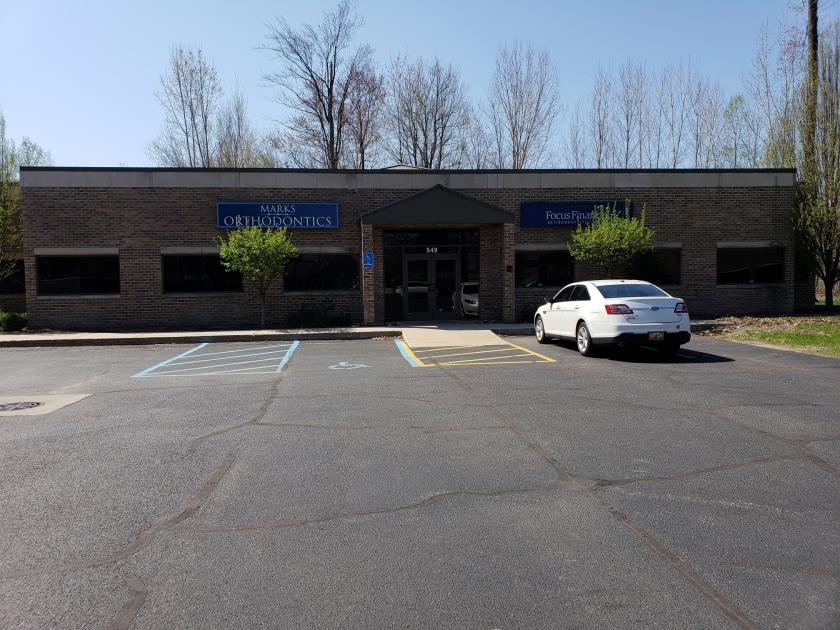
1-Mile | 3-Miles | 5-Miles | ||
---|---|---|---|---|
Total Population | 8,092 | 54,325 | 106,957 | |
Population Median Age | 39 | 39 | 40 | |
Population by Age | 0-9 Yrs | 1004 (12%) | 7235 (13%) | 12631 (11%) |
10-19 Yrs | 988 (12%) | 7021 (12%) | 13728 (12%) | |
20-29 Yrs | 1343 (16%) | 7370 (13%) | 14592 (13%) | |
30-39 Yrs | 892 (11%) | 7022 (12%) | 13171 (12%) | |
40-49 Yrs | 893 (11%) | 5977 (11%) | 11904 (11%) | |
50-59 Yrs | 1059 (13%) | 7113 (13%) | 14652 (13%) | |
60-69 Yrs | 1003 (12%) | 6714 (12%) | 13970 (13%) | |
70+ Yrs | 910 (11%) | 5872 (10%) | 12308 (11%) | |
Median HH Income | $44,921 | $43,738 | $45,621 | |
Total Household Income | < 24K | 824 (24%) | 5595 (25%) | 10908 (25%) |
25-49K | 971 (28%) | 6720 (30%) | 11652 (27%) | |
50-74K | 778 (22%) | 4072 (18%) | 7548 (17%) | |
75-99K | 343 (10%) | 2235 (10%) | 4587 (10%) | |
100-199K | 405 (11%) | 2761 (12%) | 6037 (14%) | |
200K+ | 88 (2%) | 624 (2%) | 1403 (3%) | |
Highest Education Level | No Diploma | 643 | 3547 | 7268 |
Diploma or GED | 1720 | 11049 | 22058 | |
Some College | 1268 | 9355 | 17975 | |
Assoc. Degree | 529 | 4413 | 8623 | |
Bachelors Degree | 834 | 5596 | 11568 | |
Higher Degree | 452 | 2529 | 6082 | |
Total Housing Units | 3,875 | 24,873 | 48,330 | |
--Owner-Occupied | 1,925 | 14,474 | 28,414 | |
--Renter-Occupied | 1,485 | 7,533 | 13,721 | |
Owner-Occupied Values | < 100K | 998 | 7225 | 12228 |
100-199K | 577 | 4811 | 9736 | |
200-299K | 179 | 1542 | 3794 | |
300-399K | 64 | 484 | 1490 | |
400-499K | 60 | 160 | 468 | |
500K+ | 46 | 252 | 697 | |
Total Working Age Population | 6,616 | 42,530 | 85,974 | |
In Work Force | 4,165 | 26,217 | 49,407 | |
Not In Work Force | 2,450 | 16,312 | 36,567 | |
Workforce Employed | 3,814 | 24,122 | 45,971 | |
Workforce Unemployed | 340 | 2,075 | 3,398 | |
Civlian Workforce | 4,154 | 26,197 | 49,369 | |
Military Workforce | 11 | 20 | 37 | |
Total Households | 3,409 | 22,007 | 42,135 | |
Family Households | 2,015 | 13,796 | 25,996 | |
Non-Family Households | 1,394 | 8,211 | 16,139 | |
Married Couple | 1,195 | 8,306 | 16,793 | |
Other Family | 820 | 5,490 | 9,203 | |
Married w/Child | 408 | 2,753 | 5,477 | |
Single Male w/Child | 147 | 760 | 1,234 | |
Single Female w/Child | 249 | 2,567 | 4,272 |
Population Change Last Two Decades - Plus Projection
2000 | % | 2010 | % | 2020 | % | 2030 | |
---|---|---|---|---|---|---|---|
Michigan | 9,938,444 | -1 | 9,883,640 | +1 | 10,023,423 | +4 | 10,424,510 |
Muskegon County | 170,200 | +1 | 172,188 | +2 | 175,323 | +4 | 182,278 |
Ottawa County | 238,314 | +11 | 263,801 | +12 | 295,791 | +12 | 331,723 |
Total Working Age Population:
Total Households:
Total Working Age Population:
Total Households:
Total Working Age Population:
Total Households: