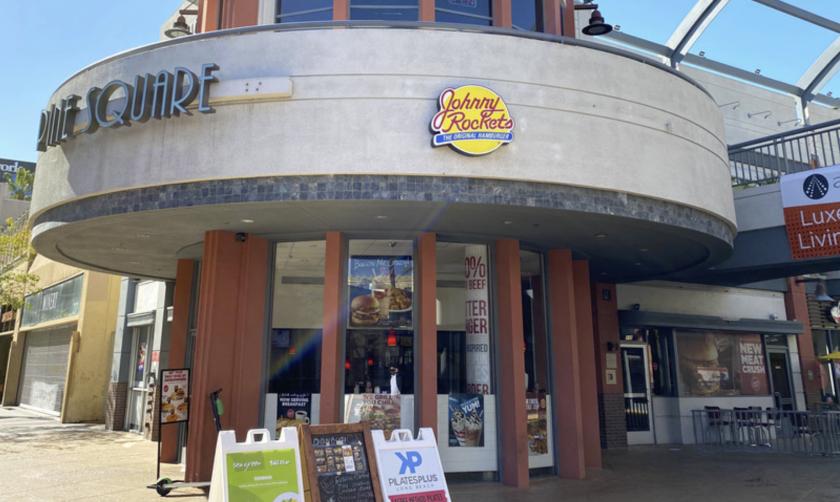
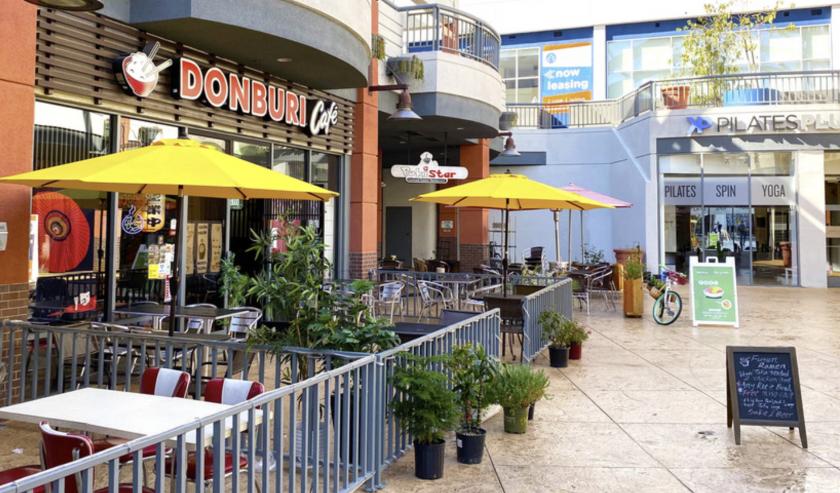
1-Mile | 3-Miles | 5-Miles | ||
---|---|---|---|---|
Total Population | 52,896 | 249,750 | 447,606 | |
Population Median Age | 37 | 36 | 37 | |
Population by Age | 0-9 Yrs | 6061 (11%) | 30190 (12%) | 52876 (11%) |
10-19 Yrs | 5101 (9%) | 26612 (10%) | 50722 (11%) | |
20-29 Yrs | 9504 (17%) | 45326 (18%) | 75672 (16%) | |
30-39 Yrs | 10201 (19%) | 45045 (18%) | 73227 (16%) | |
40-49 Yrs | 7247 (13%) | 32283 (12%) | 59229 (13%) | |
50-59 Yrs | 6546 (12%) | 32840 (13%) | 59473 (13%) | |
60-69 Yrs | 5116 (9%) | 21623 (8%) | 41747 (9%) | |
70+ Yrs | 3121 (5%) | 15832 (6%) | 34660 (7%) | |
Median HH Income | $51,860 | $58,545 | $65,829 | |
Total Household Income | < 24K | 6597 (26%) | 19946 (20%) | 29581 (17%) |
25-49K | 5311 (21%) | 22263 (22%) | 34302 (20%) | |
50-74K | 4516 (18%) | 18863 (19%) | 30706 (18%) | |
75-99K | 2967 (12%) | 12656 (12%) | 22062 (13%) | |
100-199K | 3859 (15%) | 19278 (19%) | 37820 (22%) | |
200K+ | 1287 (5%) | 6003 (6%) | 14489 (8%) | |
Highest Education Level | No Diploma | 7910 | 40136 | 64423 |
Diploma or GED | 6193 | 28033 | 51023 | |
Some College | 8758 | 38642 | 66442 | |
Assoc. Degree | 2455 | 11390 | 22506 | |
Bachelors Degree | 8227 | 35961 | 66273 | |
Higher Degree | 4807 | 20074 | 39651 | |
Total Housing Units | 27,014 | 106,907 | 180,763 | |
--Owner-Occupied | 4,762 | 26,604 | 60,837 | |
--Renter-Occupied | 19,775 | 72,405 | 108,123 | |
Owner-Occupied Values | < 100K | 60 | 342 | 1564 |
100-199K | 215 | 504 | 1177 | |
200-299K | 503 | 1783 | 3466 | |
300-399K | 1504 | 5970 | 9821 | |
400-499K | 1014 | 5946 | 11118 | |
500K+ | 1465 | 12058 | 33690 | |
Total Working Age Population | 43,779 | 203,405 | 365,001 | |
In Work Force | 31,012 | 139,339 | 243,287 | |
Not In Work Force | 12,767 | 64,066 | 121,714 | |
Workforce Employed | 28,668 | 131,557 | 229,924 | |
Workforce Unemployed | 2,270 | 7,656 | 13,183 | |
Civlian Workforce | 30,938 | 139,213 | 243,107 | |
Military Workforce | 74 | 126 | 180 | |
Total Households | 24,537 | 99,009 | 168,960 | |
Family Households | 9,684 | 49,942 | 93,014 | |
Non-Family Households | 14,853 | 49,068 | 75,946 | |
Married Couple | 5,804 | 30,531 | 60,671 | |
Other Family | 3,880 | 19,410 | 32,343 | |
Married w/Child | 2,050 | 12,303 | 23,965 | |
Single Male w/Child | 739 | 2,754 | 4,825 | |
Single Female w/Child | 1,561 | 7,392 | 11,442 |
Population Change Last Two Decades - Plus Projection
2000 | % | 2010 | % | 2020 | % | 2030 | |
---|---|---|---|---|---|---|---|
California | 33,871,648 | +10 | 37,253,956 | +9 | 40,467,295 | +8 | 43,631,295 |
Los Angeles County | 9,519,338 | +3 | 9,818,605 | +6 | 10,369,367 | +4 | 10,759,850 |
Orange County | 2,846,289 | +6 | 3,010,232 | +8 | 3,257,087 | +5 | 3,431,096 |
Total Working Age Population:
Total Households:
Total Working Age Population:
Total Households:
Total Working Age Population:
Total Households: