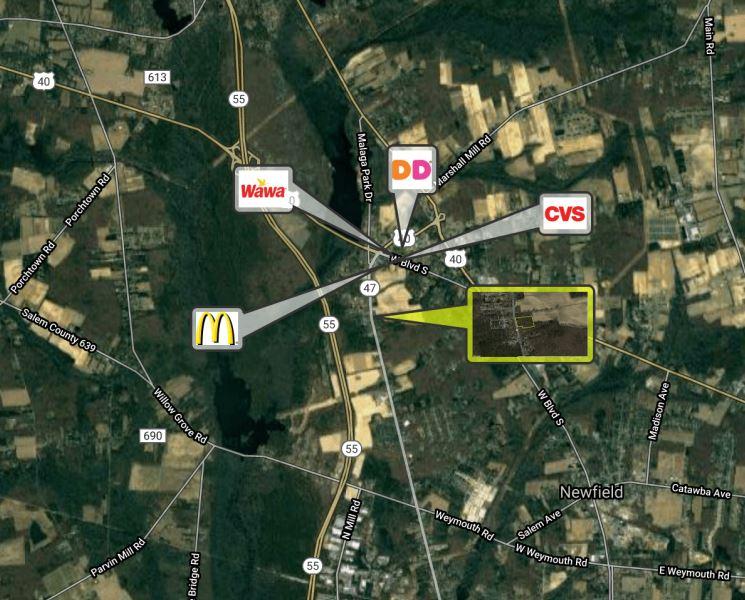
Commercial Land
140 Delsea Drive Newfield, NJ 08344
140 Delsea Drive Newfield, NJ 08344
Details & Description
Property Highlights
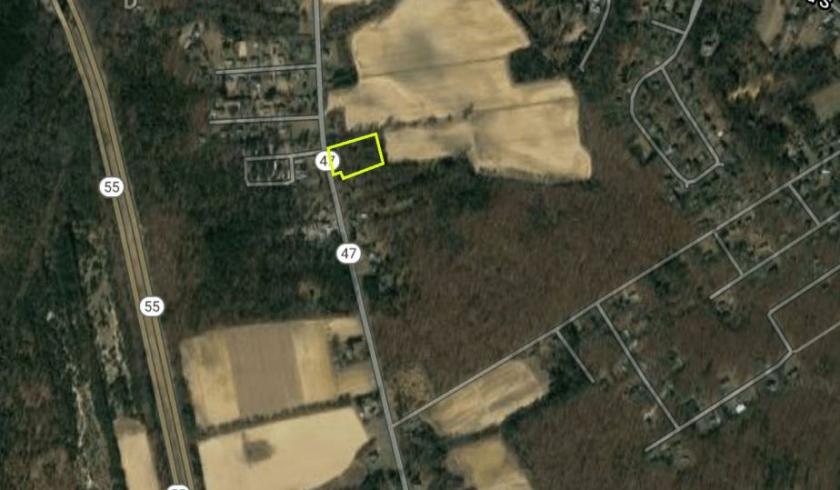
- • Block 5101 Lots 15, 17 18
- • Situated on - 2.67 acres
- • Approximately 217 of frontage on Delsea Drive
- • Zoned Malaga Village
Listing Agents

Tammi Coppinger
O: 856-857-6303
tammi.coppinger@wolfcre.com
O: 856-857-6303
tammi.coppinger@wolfcre.com
While we strive to provide the most accurate information, all listing information, and demographic data, is provided by third-parties. As such, MyEListing will not be responsible for the accuracy of the information. It is strongly recommended that you verify all information with the listing agent, and any relevant agencies, prior to making any decisions.