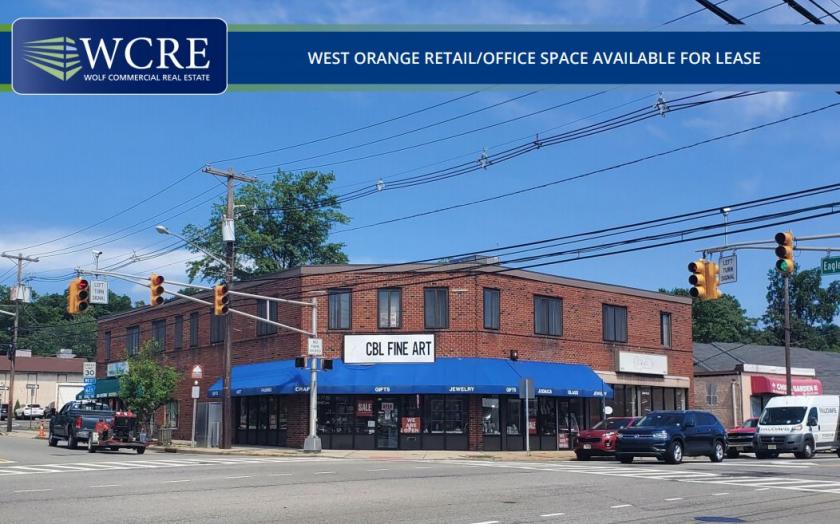
Office Space
457 Pleasant Valley Way West Orange, NJ 07052
457 Pleasant Valley Way West Orange, NJ 07052
Details & Description
Property Highlights
- • 1,750 SF Ground level retail space
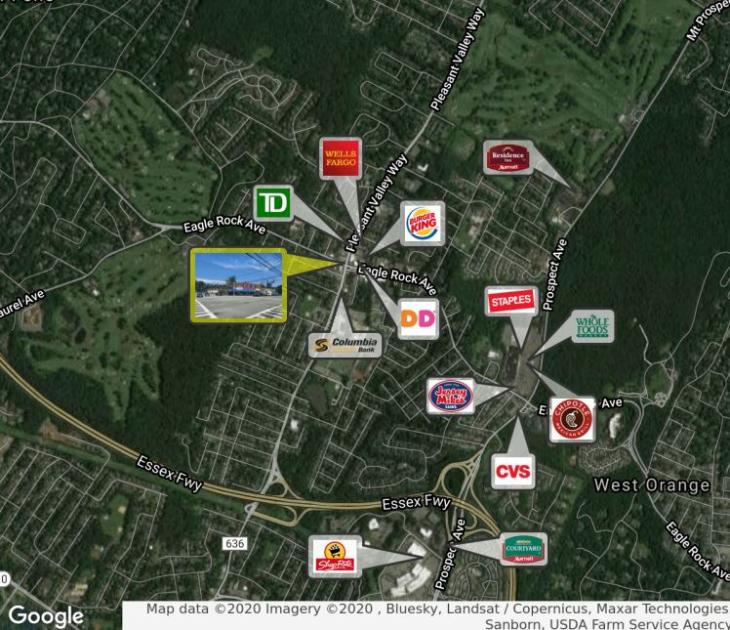
- • Easy access to 280 and Garden State Parkway
- • 45-minute drive to Midtown Manhattan
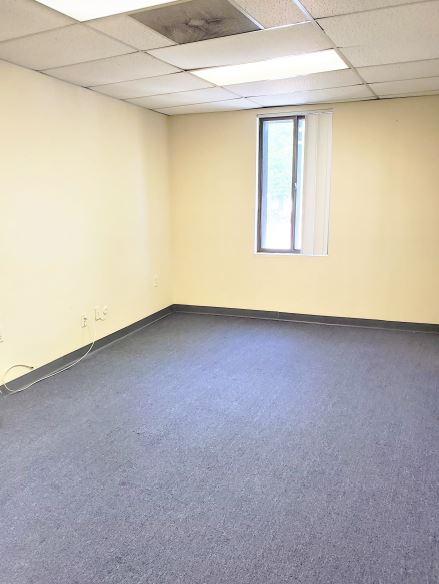
Additional Photos


Listing Agents

Tammi Coppinger
O: 856-857-6303
tammi.coppinger@wolfcre.com
O: 856-857-6303
tammi.coppinger@wolfcre.com
While we strive to provide the most accurate information, all listing information, and demographic data, is provided by third-parties. As such, MyEListing will not be responsible for the accuracy of the information. It is strongly recommended that you verify all information with the listing agent, and any relevant agencies, prior to making any decisions.


