Commercial Land
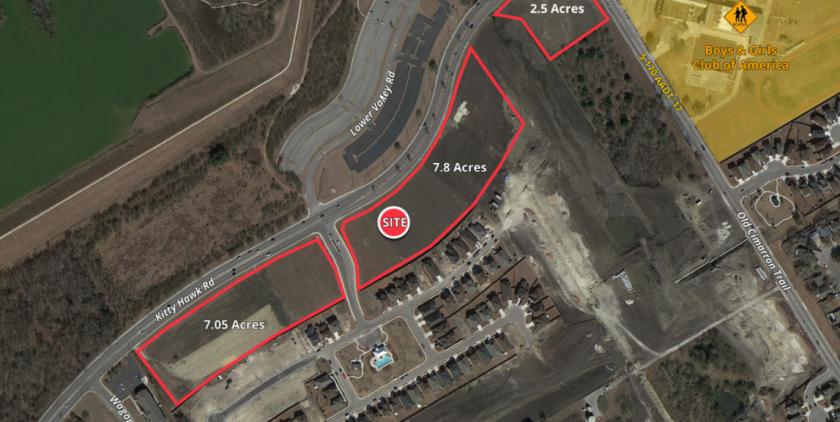
Kitty Hawk Rd Universal City, TX 78148
Kitty Hawk Rd Universal City, TX 78148
Details & Description
Property Highlights
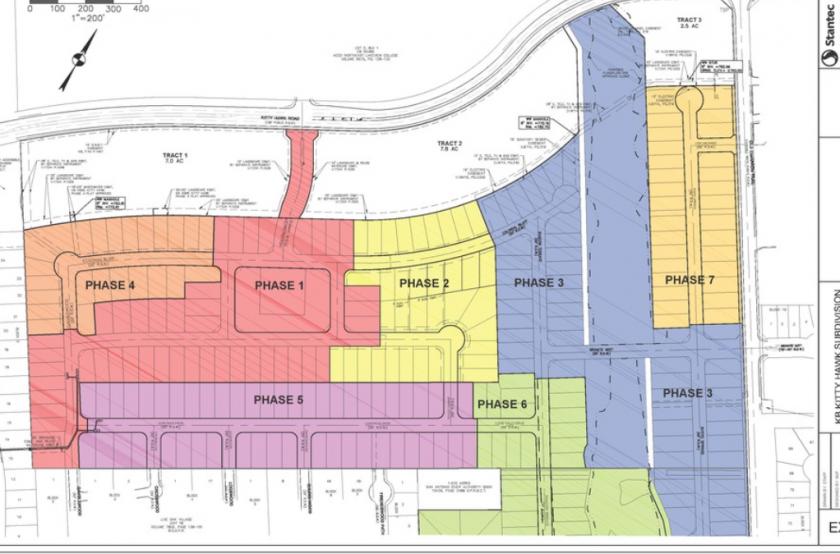
• KB Kitty Hawk Subdivision is underway with 250 homes proposed over seven phases.
• Owner will consider partial sales and pad sales.
Listing Agents

Drew Allen
M: 210-827-4097
drew.allen@srsre.com
M: 210-827-4097
drew.allen@srsre.com
While we strive to provide the most accurate information, all listing information, and demographic data, is provided by third-parties. As such, MyEListing will not be responsible for the accuracy of the information. It is strongly recommended that you verify all information with the listing agent, and any relevant agencies, prior to making any decisions.