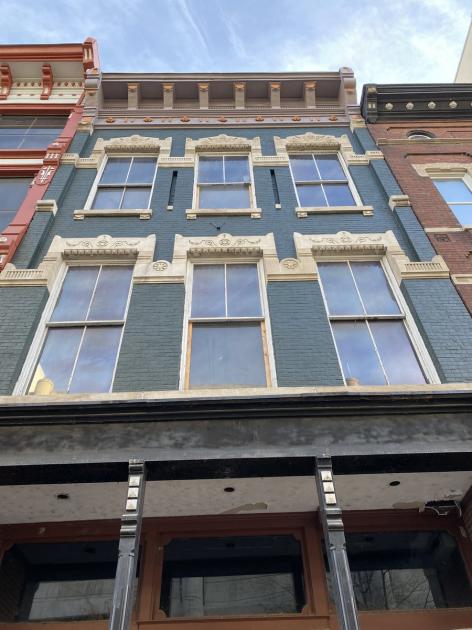
Retail Space
121 South 7th Street Louisville, KY 40202
121 South 7th Street Louisville, KY 40202
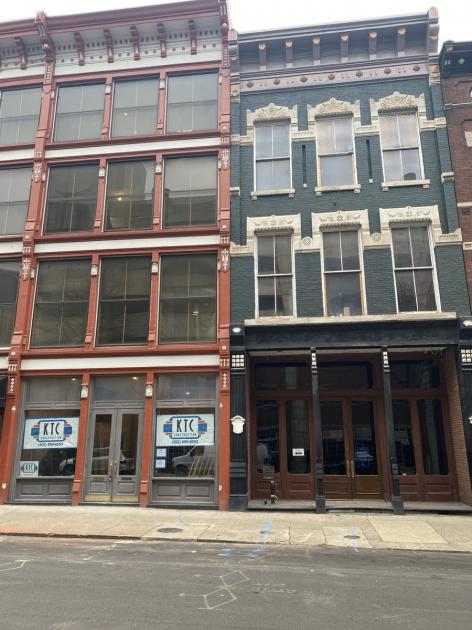
Details & Description
Property Highlights
• Located in the West Main Art and Entertainment District which includes 21 C Hotel, Louisville Slugger Museum, and Frazi
• Located on South 7th Street just south of Main Street
Listing Agents

Frank Bellis
O: 502-454-0911
fbellis@triocpg.com
O: 502-454-0911
fbellis@triocpg.com
While we strive to provide the most accurate information, all listing information, and demographic data, is provided by third-parties. As such, MyEListing will not be responsible for the accuracy of the information. It is strongly recommended that you verify all information with the listing agent, and any relevant agencies, prior to making any decisions.