Property Highlights
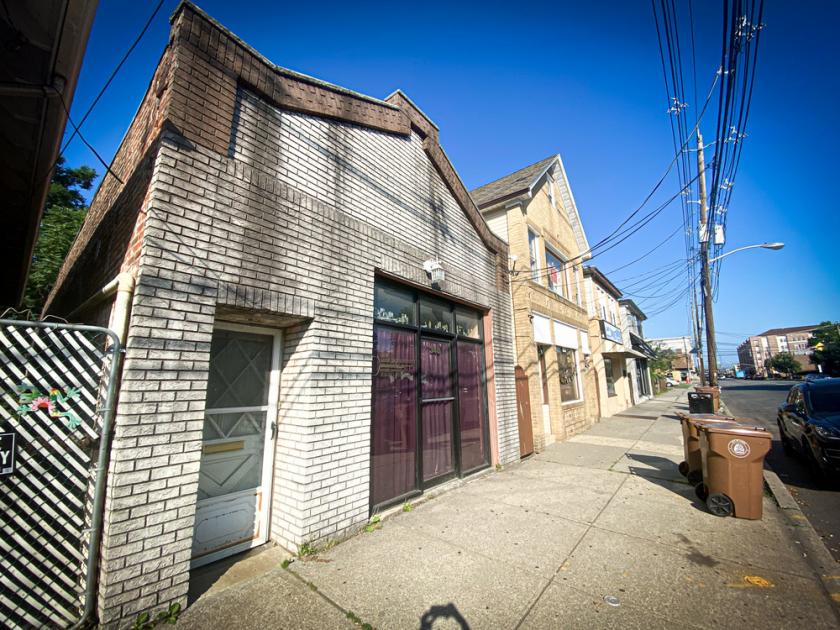
±1,000 sf building
Zone OPT (Office, Professional, Transition) which allows for various retail and professional uses, as well as garden and upper floor apartments
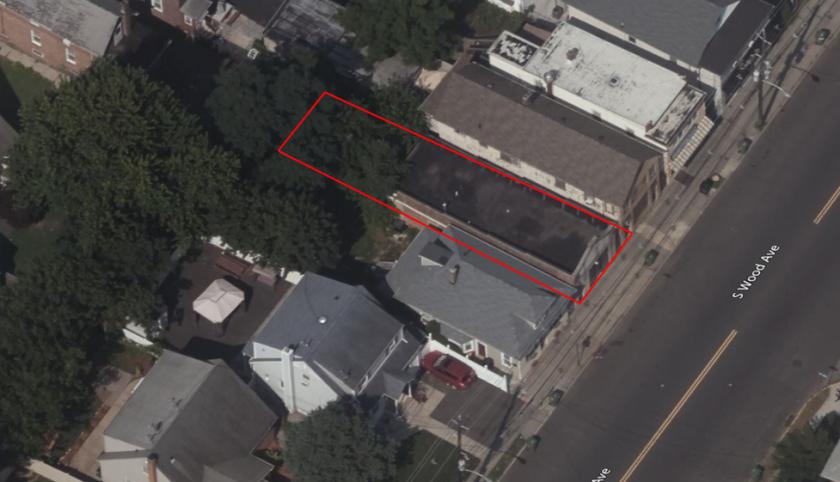
Includes a backyard in the back of the building
Walking distance to bus stop (NJ Transit Bus 56 and 57)
Lot size at 20' x 100' (Block 463, Lot 47)
Taxes: $6,960 (2021)
Accessibility
Right off of US Highway 1
0.4 miles from Linden Commuter Rail
3.0 miles from Rahway Commuter Rail
9.6 miles from Newark Liberty International Airport
No part of this information may be copied, reproduced, repurposed, or screen-captured for any commercial purpose without prior written authorization from MyEListing.
While we strive to provide the most accurate information, all listing information, and demographic data, is provided by third-parties. As such, MyEListing will not be responsible for the accuracy of the information. It is strongly recommended that you verify all information with the listing agent, and any relevant agencies, prior to making any decisions.
What is the building size of this Retail property in Linden, NJ?
The size of the building/unit at 348 South Wood Avenue in Linden is 1,000 square feet
How much land does the Linden, NJ property at 348 South Wood Avenue include?
348 South Wood Avenue in Linden includes 0.050 acres of land
What kind of Retail is the propery at 348 South Wood Avenue?
The property at 348 South Wood Avenue Linden, NJ 07036 is listed as a Other Retail Retail property
What is the population within 1 mile of 348 South Wood Avenue in Linden?
The population within 1 mile of 348 South Wood Avenue Linden, NJ 07036 is 18,401 people.
Who do I contact for questions about 348 South Wood Avenue?
You should contact the listing agent,
Justyna Kuczaj, for any details regarding this commercial listing.