Retail Space
8301 Jones Road Houston, TX 77065
8301 Jones Road Houston, TX 77065

Details & Description
Property Highlights
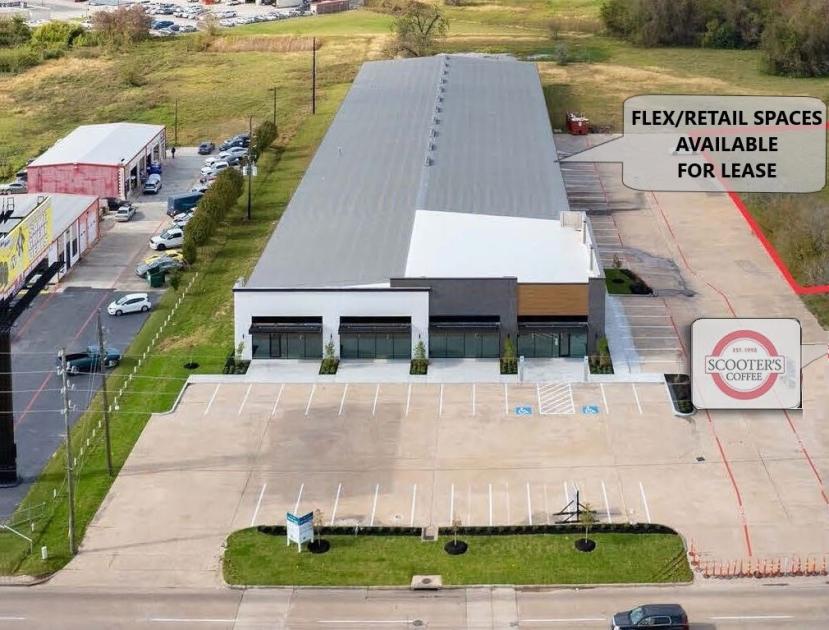
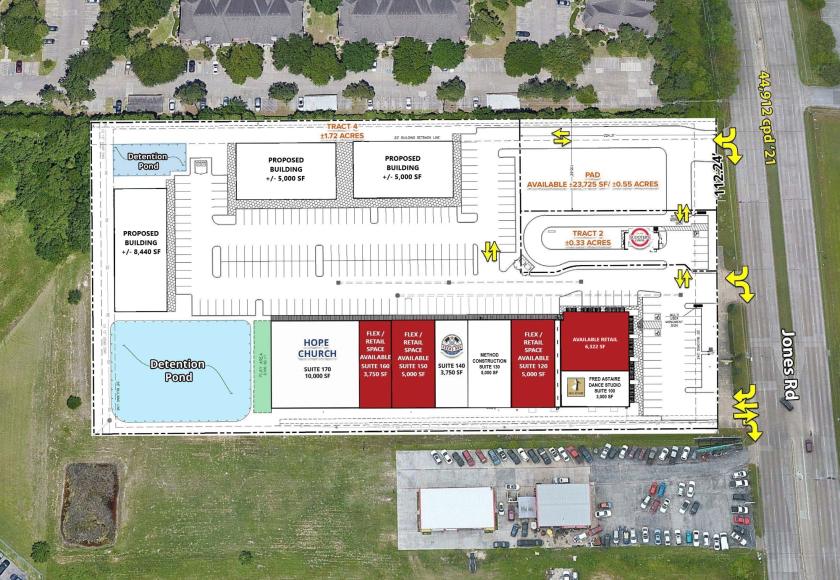
• Average traffic of over 44,000 vehicles per day on Jones Road and over 215,000 vehicles per day on nearby Highway 290
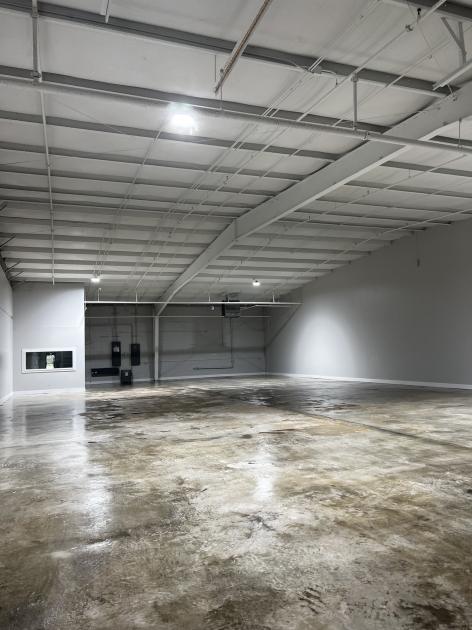
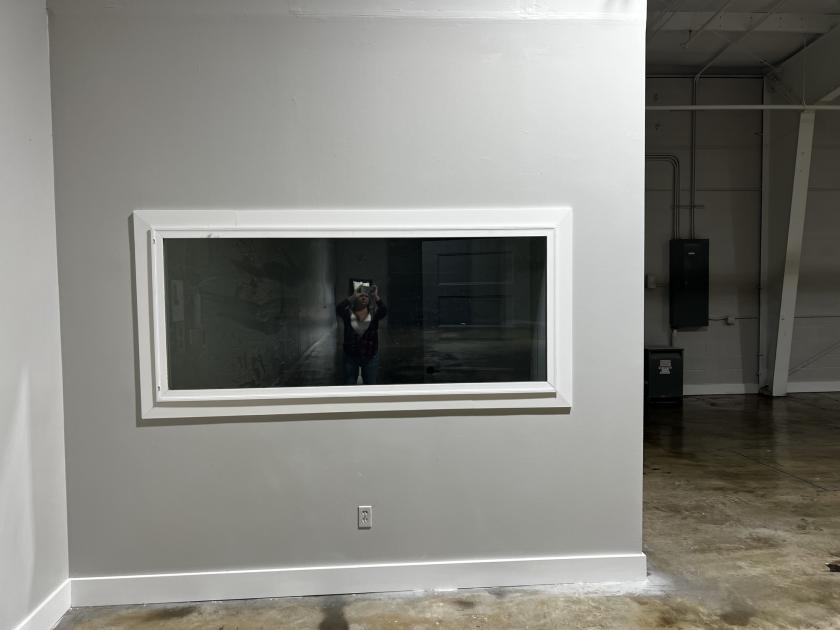
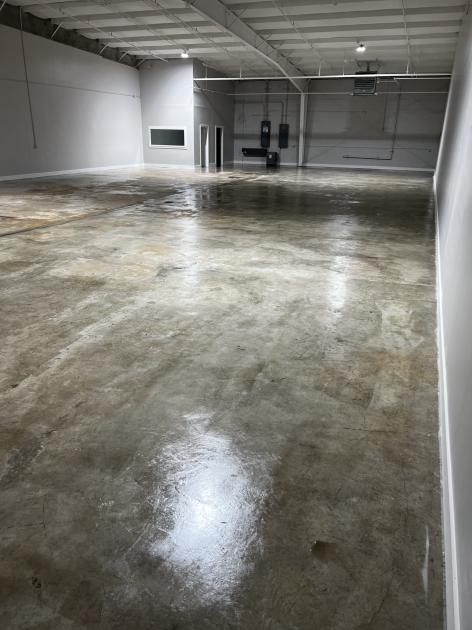
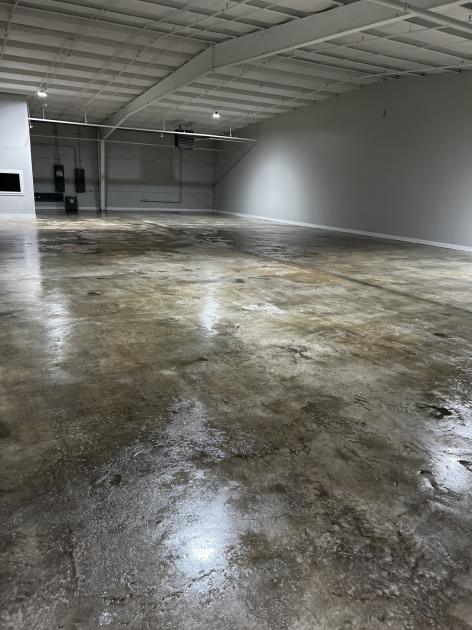
• Recently redeveloped retail/flex building with 18,750 SF of flex/retail space available for lease
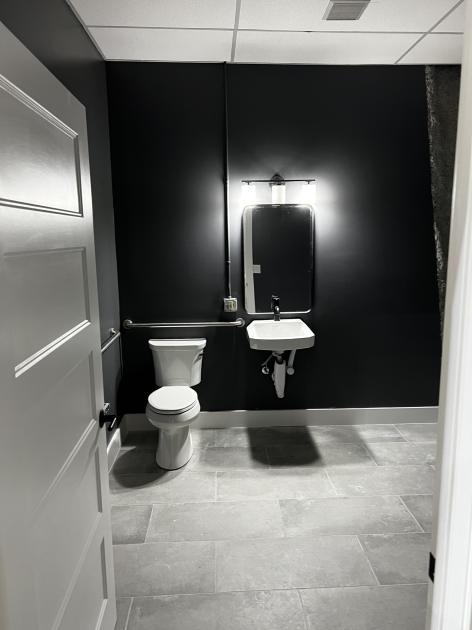
Additional Photos
Listing Agents

Joel English
O: 713-473-7200
joel@texascres.com
O: 713-473-7200
joel@texascres.com
While we strive to provide the most accurate information, all listing information, and demographic data, is provided by third-parties. As such, MyEListing will not be responsible for the accuracy of the information. It is strongly recommended that you verify all information with the listing agent, and any relevant agencies, prior to making any decisions.