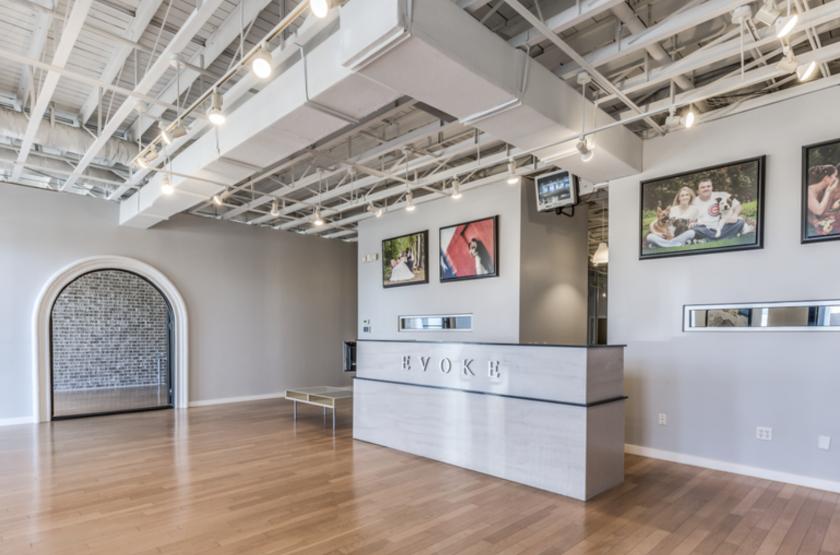
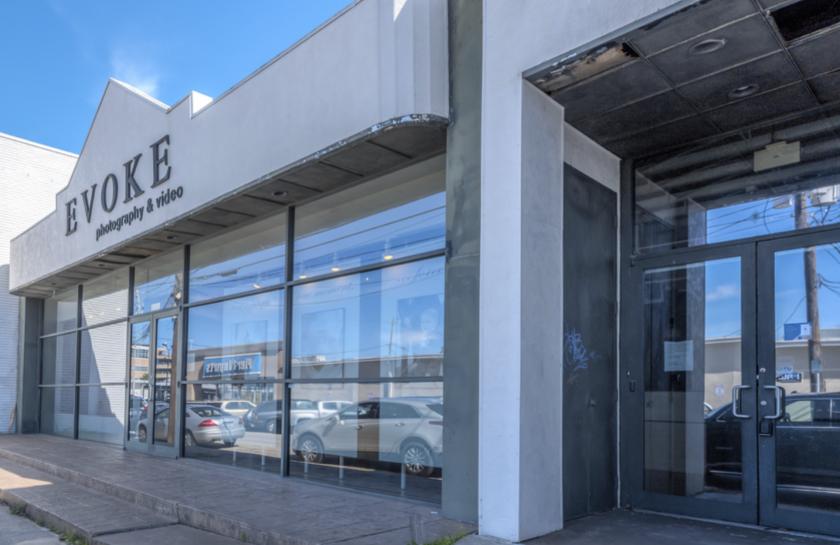
1-Mile | 3-Miles | 5-Miles | ||
---|---|---|---|---|
Total Population | 23,001 | 180,481 | 451,941 | |
Population Median Age | 37 | 38 | 36 | |
Population by Age | 0-9 Yrs | 3162 (13%) | 17559 (9%) | 51619 (11%) |
10-19 Yrs | 3044 (13%) | 14302 (7%) | 41846 (9%) | |
20-29 Yrs | 3379 (14%) | 37898 (20%) | 94932 (21%) | |
30-39 Yrs | 2935 (12%) | 33610 (18%) | 84941 (18%) | |
40-49 Yrs | 3003 (13%) | 22506 (12%) | 57260 (12%) | |
50-59 Yrs | 2733 (11%) | 21477 (11%) | 49321 (10%) | |
60-69 Yrs | 2567 (11%) | 18768 (10%) | 40569 (8%) | |
70+ Yrs | 2178 (9%) | 14361 (7%) | 31453 (6%) | |
Median HH Income | $152,644 | $89,458 | $75,433 | |
Total Household Income | < 24K | 869 (9%) | 12273 (14%) | 37407 (18%) |
25-49K | 700 (8%) | 11830 (13%) | 32751 (16%) | |
50-74K | 879 (10%) | 13838 (15%) | 30736 (15%) | |
75-99K | 742 (8%) | 9495 (10%) | 20941 (10%) | |
100-199K | 2013 (23%) | 19305 (22%) | 43163 (21%) | |
200K+ | 3494 (40%) | 20123 (23%) | 37517 (18%) | |
Highest Education Level | No Diploma | 116 | 3887 | 28916 |
Diploma or GED | 491 | 8449 | 37785 | |
Some College | 902 | 15516 | 42421 | |
Assoc. Degree | 519 | 5815 | 14427 | |
Bachelors Degree | 5420 | 46276 | 101665 | |
Higher Degree | 7282 | 53185 | 94298 | |
Total Housing Units | 9,501 | 100,606 | 234,468 | |
--Owner-Occupied | 5,216 | 35,776 | 78,387 | |
--Renter-Occupied | 3,481 | 51,089 | 124,128 | |
Owner-Occupied Values | < 100K | 109 | 1241 | 5779 |
100-199K | 183 | 3300 | 8835 | |
200-299K | 227 | 3728 | 9806 | |
300-399K | 300 | 3305 | 11724 | |
400-499K | 296 | 3600 | 9171 | |
500K+ | 4102 | 20602 | 33071 | |
Total Working Age Population | 18,136 | 154,078 | 376,296 | |
In Work Force | 11,273 | 107,997 | 266,362 | |
Not In Work Force | 6,864 | 46,081 | 109,934 | |
Workforce Employed | 10,824 | 104,242 | 255,349 | |
Workforce Unemployed | 403 | 3,641 | 10,879 | |
Civlian Workforce | 11,228 | 107,883 | 266,228 | |
Military Workforce | 45 | 114 | 134 | |
Total Households | 8,697 | 86,864 | 202,515 | |
Family Households | 5,411 | 39,547 | 96,844 | |
Non-Family Households | 3,286 | 47,317 | 105,671 | |
Married Couple | 4,859 | 33,380 | 71,596 | |
Other Family | 552 | 6,167 | 25,248 | |
Married w/Child | 2,311 | 12,860 | 28,784 | |
Single Male w/Child | 89 | 652 | 2,707 | |
Single Female w/Child | 189 | 2,133 | 9,777 |
Population Change Last Two Decades - Plus Projection
2000 | % | 2010 | % | 2020 | % | 2030 | |
---|---|---|---|---|---|---|---|
Texas | 20,851,820 | +21 | 25,145,561 | +18 | 29,677,668 | +18 | 34,894,452 |
Fort Bend County | 354,452 | +65 | 585,375 | +44 | 840,383 | +43 | 1,203,029 |
Harris County | 3,400,578 | +20 | 4,092,459 | +22 | 4,978,845 | +19 | 5,924,750 |
Total Working Age Population:
Total Households:
Total Working Age Population:
Total Households:
Total Working Age Population:
Total Households: