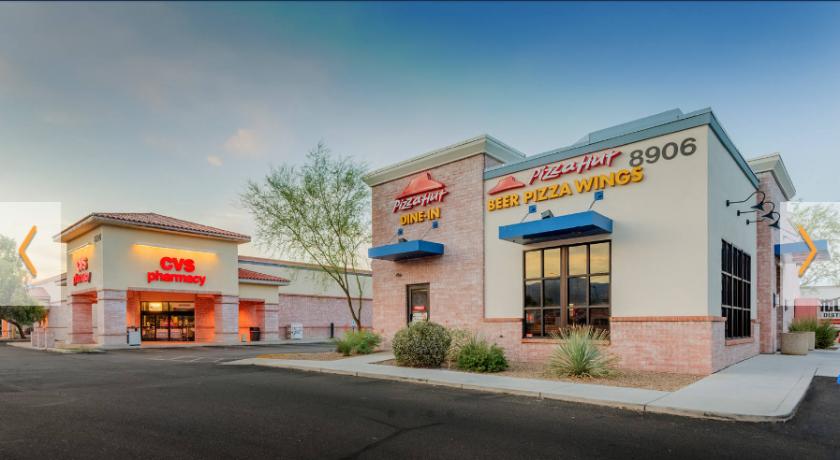
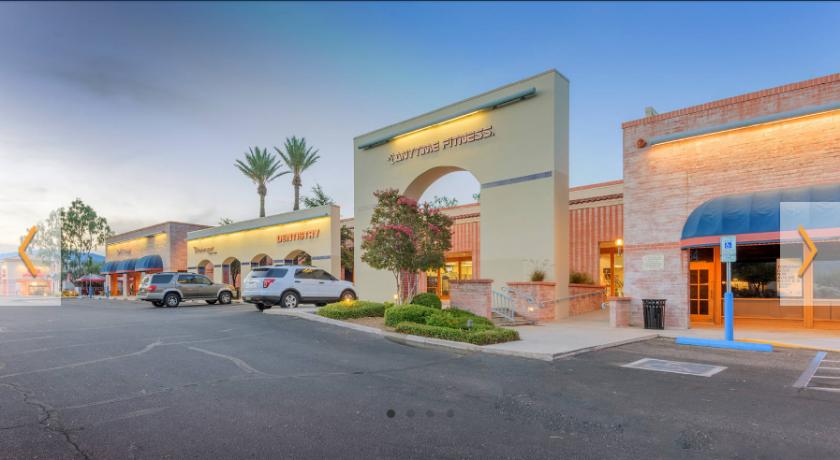
1-Mile | 3-Miles | 5-Miles | ||
---|---|---|---|---|
Total Population | 3,394 | 36,003 | 106,101 | |
Population Median Age | 46 | 46 | 45 | |
Population by Age | 0-9 Yrs | 262 (7%) | 3052 (8%) | 9197 (8%) |
10-19 Yrs | 418 (12%) | 4004 (11%) | 10450 (9%) | |
20-29 Yrs | 311 (9%) | 3955 (10%) | 14036 (13%) | |
30-39 Yrs | 347 (10%) | 3191 (8%) | 10742 (10%) | |
40-49 Yrs | 340 (10%) | 4022 (11%) | 10831 (10%) | |
50-59 Yrs | 516 (15%) | 5160 (14%) | 13860 (13%) | |
60-69 Yrs | 674 (19%) | 6490 (18%) | 17451 (16%) | |
70+ Yrs | 527 (15%) | 6130 (17%) | 19535 (18%) | |
Median HH Income | $84,591 | $73,578 | $59,754 | |
Total Household Income | < 24K | 155 (10%) | 2102 (13%) | 9736 (19%) |
25-49K | 175 (12%) | 3036 (19%) | 11427 (23%) | |
50-74K | 285 (20%) | 2983 (18%) | 8653 (17%) | |
75-99K | 242 (17%) | 1955 (12%) | 5807 (11%) | |
100-199K | 382 (26%) | 3985 (25%) | 9841 (19%) | |
200K+ | 176 (12%) | 1831 (11%) | 4148 (8%) | |
Highest Education Level | No Diploma | 64 | 737 | 3559 |
Diploma or GED | 384 | 3694 | 13355 | |
Some College | 551 | 5941 | 18947 | |
Assoc. Degree | 233 | 2227 | 6908 | |
Bachelors Degree | 800 | 7174 | 19982 | |
Higher Degree | 548 | 6752 | 15972 | |
Total Housing Units | 1,511 | 17,679 | 56,085 | |
--Owner-Occupied | 1,084 | 10,987 | 29,477 | |
--Renter-Occupied | 332 | 4,905 | 20,134 | |
Owner-Occupied Values | < 100K | 15 | 188 | 1915 |
100-199K | 59 | 1492 | 7292 | |
200-299K | 367 | 3734 | 8576 | |
300-399K | 319 | 2572 | 4692 | |
400-499K | 173 | 1562 | 2939 | |
500K+ | 151 | 1438 | 4063 | |
Total Working Age Population | 2,886 | 30,478 | 90,481 | |
In Work Force | 1,664 | 16,931 | 52,009 | |
Not In Work Force | 1,222 | 13,547 | 38,472 | |
Workforce Employed | 1,549 | 15,596 | 48,281 | |
Workforce Unemployed | 86 | 973 | 2,592 | |
Civlian Workforce | 1,635 | 16,569 | 50,873 | |
Military Workforce | 29 | 362 | 1,136 | |
Total Households | 1,415 | 15,892 | 49,611 | |
Family Households | 1,035 | 10,153 | 27,585 | |
Non-Family Households | 381 | 5,740 | 22,027 | |
Married Couple | 906 | 8,327 | 21,309 | |
Other Family | 128 | 1,826 | 6,276 | |
Married w/Child | 268 | 2,256 | 5,797 | |
Single Male w/Child | 8 | 134 | 729 | |
Single Female w/Child | 15 | 674 | 2,406 |
Population Change Last Two Decades - Plus Projection
2000 | % | 2010 | % | 2020 | % | 2030 | |
---|---|---|---|---|---|---|---|
Arizona | 5,130,632 | +25 | 6,392,017 | +14 | 7,286,100 | +14 | 8,284,900 |
Pima County | 843,746 | +16 | 980,263 | +7 | 1,050,900 | +7 | 1,129,200 |
Total Working Age Population:
Total Households:
Total Working Age Population:
Total Households:
Total Working Age Population:
Total Households: