Industrial Properties
71 Apsley Street Hudson, MA 01749
71 Apsley Street Hudson, MA 01749
Details & Description
Property Highlights
- • Rubber roof
- • Heavy power
- • Parking for roughly 25 cars
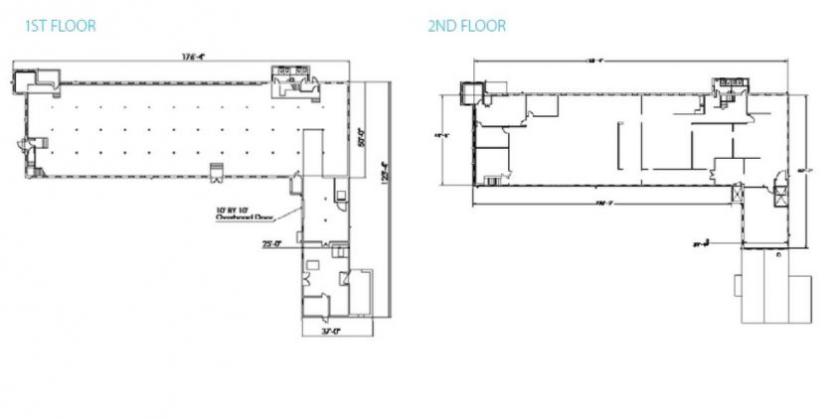
- • Typical floor 10, 480 SF
- • Construction is Brick Mill style
- • Clear Height 10
Listing Agents

Arlon Brown
O: 508-271-9215
M: 617-962-0162
arlon.brown@svn.com
O: 508-271-9215
M: 617-962-0162
arlon.brown@svn.com
While we strive to provide the most accurate information, all listing information, and demographic data, is provided by third-parties. As such, MyEListing will not be responsible for the accuracy of the information. It is strongly recommended that you verify all information with the listing agent, and any relevant agencies, prior to making any decisions.