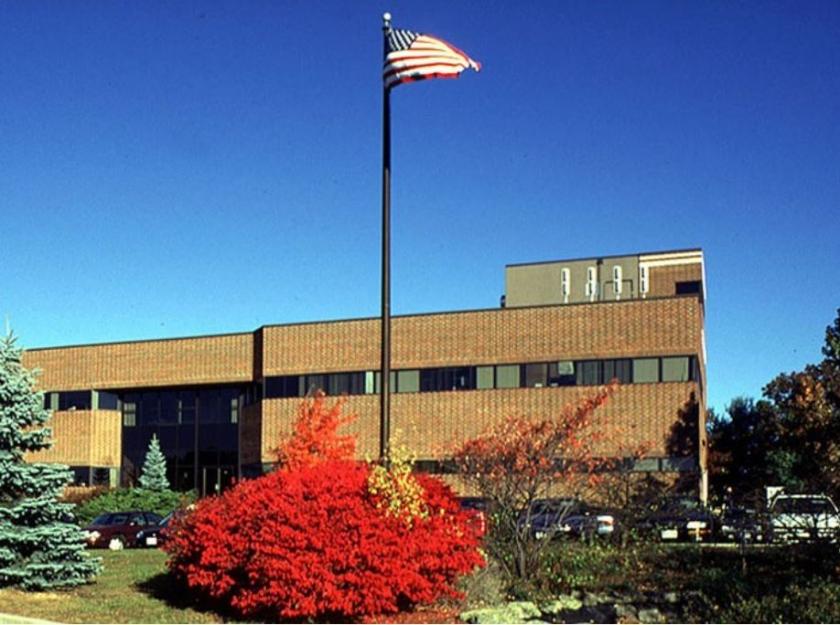
1-Mile | 3-Miles | 5-Miles | ||
---|---|---|---|---|
Total Population | 6,446 | 56,260 | 153,818 | |
Population Median Age | 38 | 39 | 39 | |
Population by Age | 0-9 Yrs | 1058 (16%) | 7057 (12%) | 18661 (12%) |
10-19 Yrs | 1040 (16%) | 9278 (16%) | 23811 (15%) | |
20-29 Yrs | 370 (5%) | 5193 (9%) | 16603 (10%) | |
30-39 Yrs | 702 (10%) | 5579 (9%) | 17681 (11%) | |
40-49 Yrs | 980 (15%) | 8424 (14%) | 21203 (13%) | |
50-59 Yrs | 971 (15%) | 8091 (14%) | 21293 (13%) | |
60-69 Yrs | 643 (9%) | 6551 (11%) | 17616 (11%) | |
70+ Yrs | 681 (10%) | 6087 (10%) | 16951 (11%) | |
Median HH Income | $160,909 | $142,964 | $123,573 | |
Total Household Income | < 24K | 157 (7%) | 1681 (8%) | 5685 (10%) |
25-49K | 152 (7%) | 1596 (8%) | 5929 (10%) | |
50-74K | 117 (5%) | 1912 (9%) | 6021 (10%) | |
75-99K | 182 (8%) | 1749 (8%) | 5080 (9%) | |
100-199K | 758 (34%) | 5953 (29%) | 16247 (29%) | |
200K+ | 804 (37%) | 6985 (35%) | 16183 (29%) | |
Highest Education Level | No Diploma | 50 | 937 | 4888 |
Diploma or GED | 455 | 3898 | 14124 | |
Some College | 383 | 3385 | 10472 | |
Assoc. Degree | 204 | 1543 | 3928 | |
Bachelors Degree | 1454 | 12172 | 31460 | |
Higher Degree | 1617 | 14831 | 37136 | |
Total Housing Units | 2,241 | 21,072 | 57,892 | |
--Owner-Occupied | 2,060 | 15,597 | 38,109 | |
--Renter-Occupied | 112 | 4,279 | 17,037 | |
Owner-Occupied Values | < 100K | 3 | 130 | 384 |
100-199K | 3 | 131 | 830 | |
200-299K | 37 | 320 | 1383 | |
300-399K | 129 | 1177 | 4565 | |
400-499K | 303 | 2291 | 5692 | |
500K+ | 1585 | 11548 | 25255 | |
Total Working Age Population | 4,665 | 43,943 | 122,020 | |
In Work Force | 3,253 | 29,620 | 82,831 | |
Not In Work Force | 1,412 | 14,323 | 39,189 | |
Workforce Employed | 3,146 | 28,439 | 79,214 | |
Workforce Unemployed | 106 | 1,114 | 3,546 | |
Civlian Workforce | 3,252 | 29,553 | 82,760 | |
Military Workforce | 1 | 67 | 71 | |
Total Households | 2,171 | 19,876 | 55,146 | |
Family Households | 1,746 | 14,757 | 40,013 | |
Non-Family Households | 426 | 5,118 | 15,132 | |
Married Couple | 1,562 | 12,734 | 33,562 | |
Other Family | 183 | 2,023 | 6,451 | |
Married w/Child | 838 | 6,404 | 15,667 | |
Single Male w/Child | 10 | 201 | 697 | |
Single Female w/Child | 64 | 708 | 2,403 |
Population Change Last Two Decades - Plus Projection
2000 | % | 2010 | % | 2020 | % | 2030 | |
---|---|---|---|---|---|---|---|
Massachusetts | 6,349,097 | +3 | 6,547,629 | +6 | 6,933,887 | +4 | 7,225,472 |
Middlesex County | 1,465,396 | +3 | 1,503,085 | +7 | 1,613,961 | +5 | 1,686,641 |
Norfolk County | 650,308 | +3 | 670,850 | +7 | 718,394 | +7 | 765,912 |
Total Working Age Population:
Total Households:
Total Working Age Population:
Total Households:
Total Working Age Population:
Total Households: