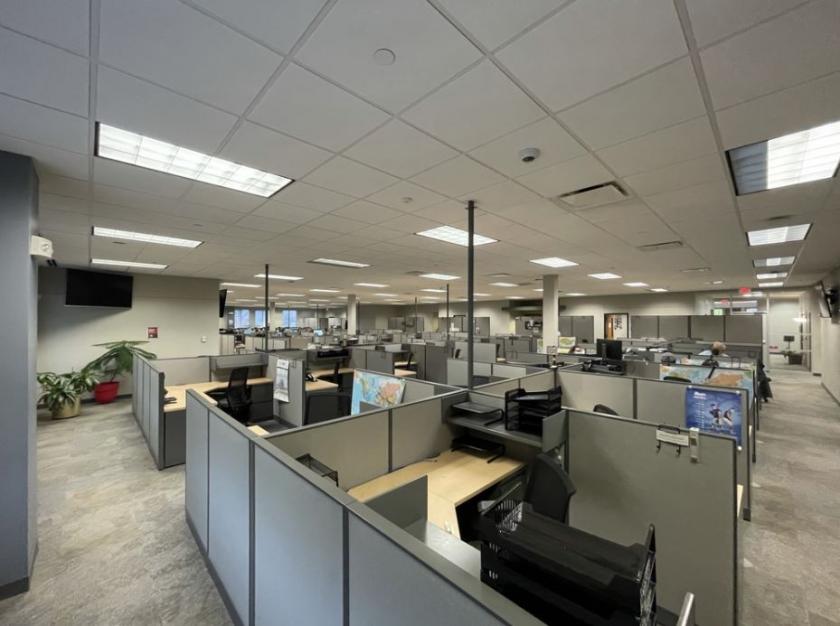
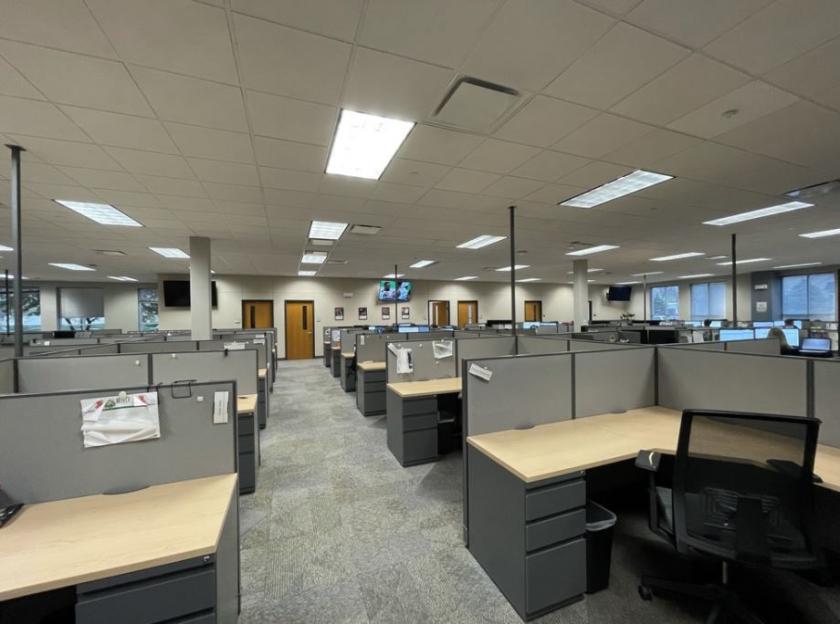
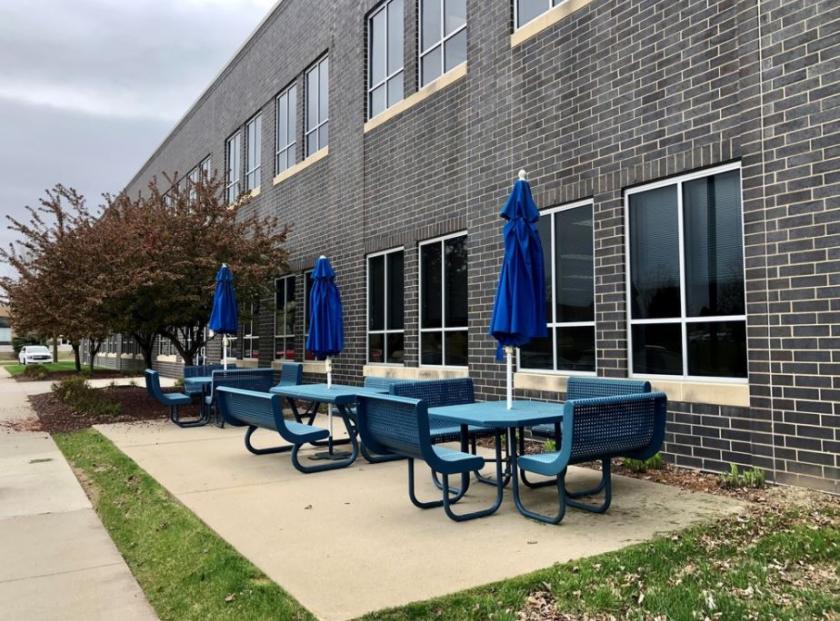
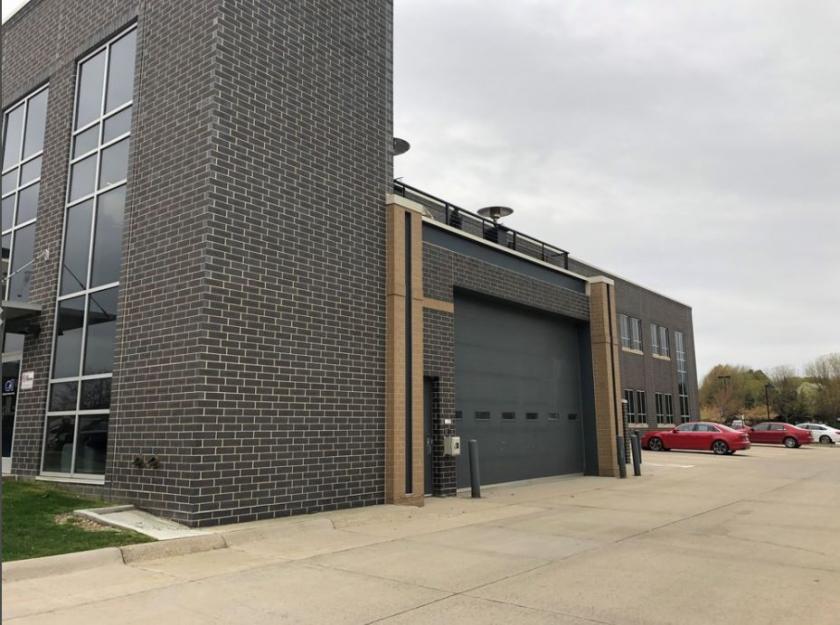
1-Mile | 3-Miles | 5-Miles | ||
---|---|---|---|---|
Total Population | 664 | 4,054 | 7,086 | |
Population Median Age | 39 | 40 | 38 | |
Population by Age | 0-9 Yrs | 76 (11%) | 528 (13%) | 1027 (14%) |
10-19 Yrs | 94 (14%) | 519 (12%) | 945 (13%) | |
20-29 Yrs | 73 (10%) | 417 (10%) | 662 (9%) | |
30-39 Yrs | 73 (10%) | 495 (12%) | 957 (13%) | |
40-49 Yrs | 111 (16%) | 561 (13%) | 945 (13%) | |
50-59 Yrs | 112 (16%) | 608 (14%) | 1064 (15%) | |
60-69 Yrs | 71 (10%) | 468 (11%) | 829 (11%) | |
70+ Yrs | 53 (7%) | 457 (11%) | 658 (9%) | |
Median HH Income | $73,520 | $73,883 | $83,202 | |
Total Household Income | < 24K | 31 (12%) | 239 (15%) | 310 (11%) |
25-49K | 44 (17%) | 281 (18%) | 425 (16%) | |
50-74K | 57 (22%) | 271 (17%) | 425 (16%) | |
75-99K | 64 (25%) | 291 (18%) | 439 (16%) | |
100-199K | 53 (20%) | 401 (25%) | 827 (31%) | |
200K+ | 5 (1%) | 70 (4%) | 183 (7%) | |
Highest Education Level | No Diploma | 13 | 111 | 172 |
Diploma or GED | 135 | 828 | 1293 | |
Some College | 98 | 588 | 980 | |
Assoc. Degree | 67 | 427 | 704 | |
Bachelors Degree | 120 | 682 | 1298 | |
Higher Degree | 36 | 196 | 391 | |
Total Housing Units | 268 | 1,654 | 2,778 | |
--Owner-Occupied | 220 | 1,270 | 2,188 | |
--Renter-Occupied | 34 | 283 | 423 | |
Owner-Occupied Values | < 100K | 71 | 265 | 336 |
100-199K | 99 | 555 | 803 | |
200-299K | 30 | 221 | 488 | |
300-399K | 15 | 136 | 311 | |
400-499K | 1 | 31 | 93 | |
500K+ | 4 | 62 | 157 | |
Total Working Age Population | 537 | 3,218 | 5,461 | |
In Work Force | 382 | 2,167 | 3,838 | |
Not In Work Force | 155 | 1,051 | 1,623 | |
Workforce Employed | 368 | 2,106 | 3,742 | |
Workforce Unemployed | 14 | 54 | 89 | |
Civlian Workforce | 382 | 2,160 | 3,831 | |
Military Workforce | 0 | 6 | 7 | |
Total Households | 254 | 1,553 | 2,611 | |
Family Households | 182 | 1,067 | 1,915 | |
Non-Family Households | 71 | 486 | 696 | |
Married Couple | 137 | 844 | 1,564 | |
Other Family | 46 | 224 | 350 | |
Married w/Child | 50 | 350 | 664 | |
Single Male w/Child | 8 | 50 | 101 | |
Single Female w/Child | 21 | 89 | 140 |
Population Change Last Two Decades - Plus Projection
2000 | % | 2010 | % | 2020 | % | 2030 | |
---|---|---|---|---|---|---|---|
Iowa | 2,926,324 | +4 | 3,046,355 | -100 | |||
Boone County | 26,224 | 0 | 26,306 | -100 | |||
Dallas County | 40,750 | +62 | 66,135 | -100 | |||
Polk County | 374,601 | +15 | 430,640 | -100 |
Total Working Age Population:
Total Households:
Total Working Age Population:
Total Households:
Total Working Age Population:
Total Households: