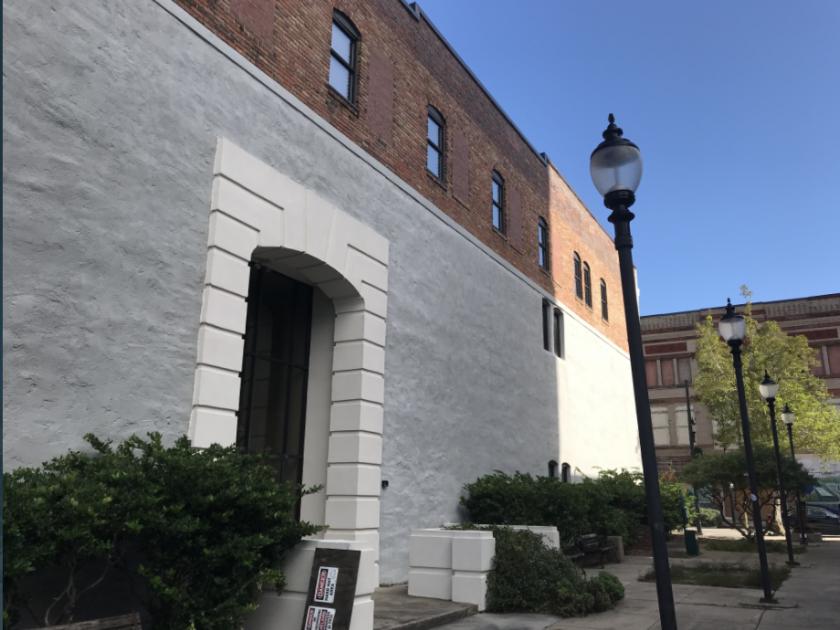
1-Mile | 3-Miles | 5-Miles | ||
---|---|---|---|---|
Total Population | 6,498 | 42,558 | 103,556 | |
Population Median Age | 42 | 39 | 39 | |
Population by Age | 0-9 Yrs | 629 (9%) | 5208 (12%) | 10655 (10%) |
10-19 Yrs | 579 (8%) | 4551 (10%) | 11947 (11%) | |
20-29 Yrs | 1014 (15%) | 6990 (16%) | 21578 (20%) | |
30-39 Yrs | 808 (12%) | 5390 (12%) | 12553 (12%) | |
40-49 Yrs | 938 (14%) | 5517 (12%) | 11928 (11%) | |
50-59 Yrs | 808 (12%) | 5403 (12%) | 12243 (11%) | |
60-69 Yrs | 933 (14%) | 5334 (12%) | 12129 (11%) | |
70+ Yrs | 791 (12%) | 4163 (9%) | 10523 (10%) | |
Median HH Income | $39,366 | $40,109 | $41,556 | |
Total Household Income | < 24K | 1157 (36%) | 6514 (35%) | 14458 (32%) |
25-49K | 589 (18%) | 4449 (23%) | 11486 (25%) | |
50-74K | 437 (13%) | 2952 (15%) | 7714 (17%) | |
75-99K | 299 (9%) | 1706 (9%) | 4495 (10%) | |
100-199K | 491 (15%) | 2218 (11%) | 5314 (11%) | |
200K+ | 157 (5%) | 741 (3%) | 1427 (3%) | |
Highest Education Level | No Diploma | 505 | 3277 | 6239 |
Diploma or GED | 990 | 7822 | 17661 | |
Some College | 915 | 5789 | 14534 | |
Assoc. Degree | 452 | 2577 | 6604 | |
Bachelors Degree | 1173 | 6468 | 15538 | |
Higher Degree | 796 | 3355 | 7541 | |
Total Housing Units | 4,187 | 21,620 | 50,493 | |
--Owner-Occupied | 1,257 | 7,746 | 19,175 | |
--Renter-Occupied | 1,874 | 10,835 | 25,720 | |
Owner-Occupied Values | < 100K | 151 | 1258 | 2631 |
100-199K | 364 | 3006 | 7883 | |
200-299K | 197 | 1464 | 4351 | |
300-399K | 266 | 971 | 2540 | |
400-499K | 87 | 489 | 954 | |
500K+ | 192 | 559 | 815 | |
Total Working Age Population | 5,620 | 34,740 | 86,884 | |
In Work Force | 3,390 | 20,903 | 53,245 | |
Not In Work Force | 2,230 | 13,836 | 33,639 | |
Workforce Employed | 3,168 | 19,404 | 49,951 | |
Workforce Unemployed | 194 | 1,419 | 3,082 | |
Civlian Workforce | 3,362 | 20,823 | 53,033 | |
Military Workforce | 28 | 80 | 211 | |
Total Households | 3,130 | 18,580 | 44,895 | |
Family Households | 1,306 | 9,310 | 21,821 | |
Non-Family Households | 1,824 | 9,271 | 23,074 | |
Married Couple | 792 | 5,383 | 14,243 | |
Other Family | 514 | 3,927 | 7,578 | |
Married w/Child | 167 | 1,567 | 4,251 | |
Single Male w/Child | 42 | 420 | 825 | |
Single Female w/Child | 179 | 1,789 | 3,482 |
Population Change Last Two Decades - Plus Projection
2000 | % | 2010 | % | 2020 | % | 2030 | |
---|---|---|---|---|---|---|---|
North Carolina | 8,049,313 | +18 | 9,535,483 | +11 | 10,630,691 | +11 | 11,836,070 |
Brunswick County | 73,143 | +47 | 107,431 | +36 | 146,135 | +23 | 179,854 |
New Hanover County | 160,307 | +26 | 202,667 | +18 | 239,272 | +16 | 276,409 |
Pender County | 41,082 | +27 | 52,217 | +24 | 64,578 | +18 | 76,106 |
Total Working Age Population:
Total Households:
Total Working Age Population:
Total Households:
Total Working Age Population:
Total Households: