Industrial Properties
3438 Hillsborough Road Durham, NC 27705
3438 Hillsborough Road Durham, NC 27705
Details & Description
Property Highlights
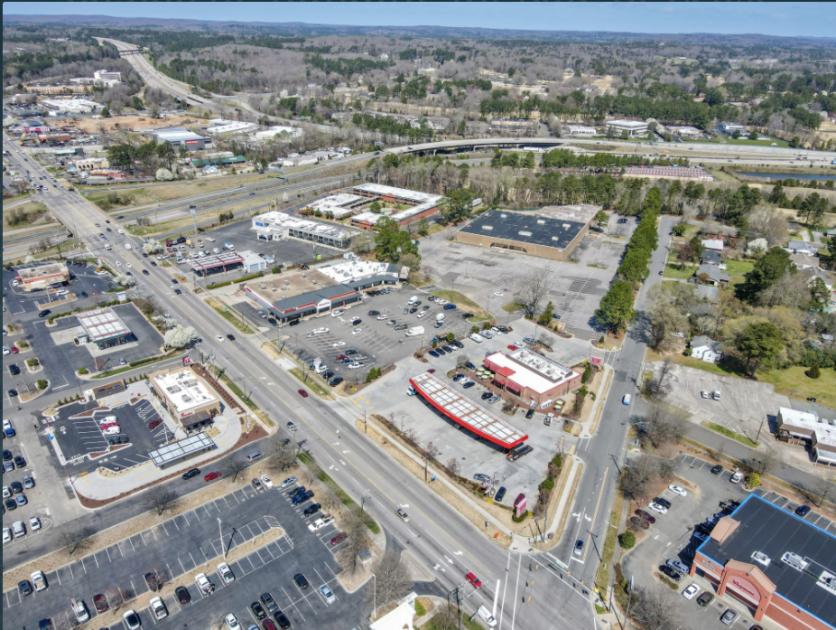
• Positioned near Highway 15-501 and Interstate 85
• Surrounded by vibrant retail area
Listing Agents

Vernon Averett
Pickett Sprouse CRE
O: 919-287-3053
vaverett@aol.com
Pickett Sprouse CRE
O: 919-287-3053
vaverett@aol.com
While we strive to provide the most accurate information, all listing information, and demographic data, is provided by third-parties. As such, MyEListing will not be responsible for the accuracy of the information. It is strongly recommended that you verify all information with the listing agent, and any relevant agencies, prior to making any decisions.

