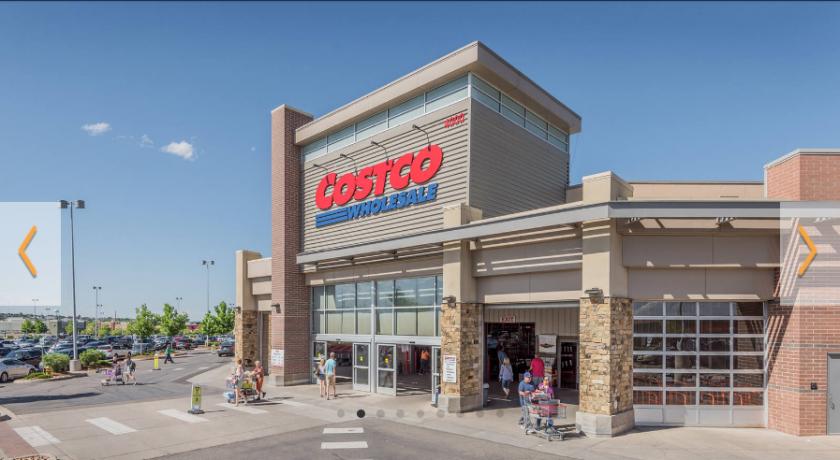
1-Mile | 3-Miles | 5-Miles | ||
---|---|---|---|---|
Total Population | 8,774 | 117,393 | 336,318 | |
Population Median Age | 40 | 39 | 39 | |
Population by Age | 0-9 Yrs | 821 (9%) | 14072 (11%) | 38761 (11%) |
10-19 Yrs | 711 (8%) | 12218 (10%) | 38625 (11%) | |
20-29 Yrs | 1547 (17%) | 19184 (16%) | 50158 (14%) | |
30-39 Yrs | 1577 (17%) | 18819 (16%) | 51938 (15%) | |
40-49 Yrs | 1035 (11%) | 13932 (11%) | 41638 (12%) | |
50-59 Yrs | 1268 (14%) | 14664 (12%) | 42030 (12%) | |
60-69 Yrs | 1023 (11%) | 12562 (10%) | 38179 (11%) | |
70+ Yrs | 791 (9%) | 11942 (10%) | 34989 (10%) | |
Median HH Income | $65,676 | $64,468 | $72,779 | |
Total Household Income | < 24K | 558 (14%) | 8473 (17%) | 20213 (14%) |
25-49K | 813 (21%) | 10446 (21%) | 26073 (19%) | |
50-74K | 802 (21%) | 8521 (17%) | 23237 (17%) | |
75-99K | 668 (17%) | 6436 (13%) | 18018 (13%) | |
100-199K | 816 (21%) | 10646 (22%) | 33325 (24%) | |
200K+ | 135 (3%) | 3465 (7%) | 14172 (10%) | |
Highest Education Level | No Diploma | 453 | 9350 | 23879 |
Diploma or GED | 1754 | 18923 | 47749 | |
Some College | 1584 | 16753 | 44035 | |
Assoc. Degree | 481 | 5926 | 14981 | |
Bachelors Degree | 1715 | 21260 | 67903 | |
Higher Degree | 679 | 10963 | 39872 | |
Total Housing Units | 3,931 | 50,649 | 141,330 | |
--Owner-Occupied | 2,187 | 26,202 | 83,131 | |
--Renter-Occupied | 1,606 | 21,784 | 51,908 | |
Owner-Occupied Values | < 100K | 189 | 1123 | 2842 |
100-199K | 141 | 2028 | 6553 | |
200-299K | 617 | 6333 | 15670 | |
300-399K | 753 | 7057 | 19427 | |
400-499K | 374 | 4384 | 15234 | |
500K+ | 112 | 5277 | 23406 | |
Total Working Age Population | 7,502 | 95,951 | 274,122 | |
In Work Force | 5,373 | 65,651 | 187,222 | |
Not In Work Force | 2,129 | 30,301 | 86,900 | |
Workforce Employed | 5,118 | 62,845 | 180,287 | |
Workforce Unemployed | 255 | 2,736 | 6,747 | |
Civlian Workforce | 5,373 | 65,581 | 187,033 | |
Military Workforce | 0 | 69 | 189 | |
Total Households | 3,793 | 47,986 | 135,039 | |
Family Households | 1,938 | 26,337 | 79,040 | |
Non-Family Households | 1,855 | 21,649 | 55,999 | |
Married Couple | 1,383 | 18,568 | 59,135 | |
Other Family | 555 | 7,769 | 19,904 | |
Married w/Child | 449 | 7,290 | 23,772 | |
Single Male w/Child | 86 | 1,138 | 3,051 | |
Single Female w/Child | 168 | 2,730 | 6,745 |
Population Change Last Two Decades - Plus Projection
2000 | % | 2010 | % | 2020 | % | 2030 | |
---|---|---|---|---|---|---|---|
Colorado | 4,301,261 | +17 | 5,029,196 | +16 | 5,838,181 | +15 | 6,733,658 |
Arapahoe County | 487,967 | +17 | 572,003 | +16 | 662,304 | +13 | 750,773 |
Denver County | 554,636 | +8 | 600,158 | +23 | 738,611 | +12 | 827,681 |
Douglas County | 175,766 | +62 | 285,465 | +23 | 350,161 | +16 | 405,087 |
Jefferson County | 527,056 | +1 | 534,543 | +10 | 587,118 | +7 | 626,742 |
Total Working Age Population:
Total Households:
Total Working Age Population:
Total Households:
Total Working Age Population:
Total Households: