Industrial Properties
1490 McDonald Avenue Brooklyn, NY 11230
1490 McDonald Avenue Brooklyn, NY 11230
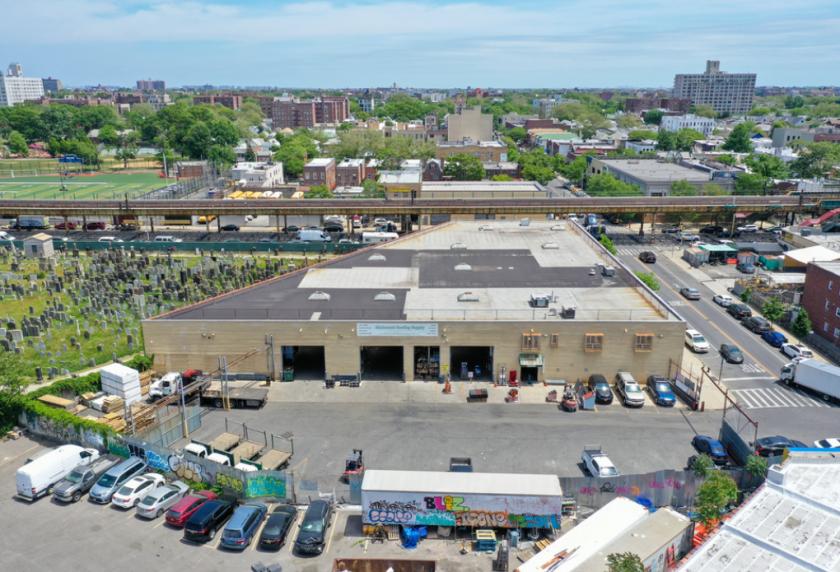
Details & Description
Property Highlights
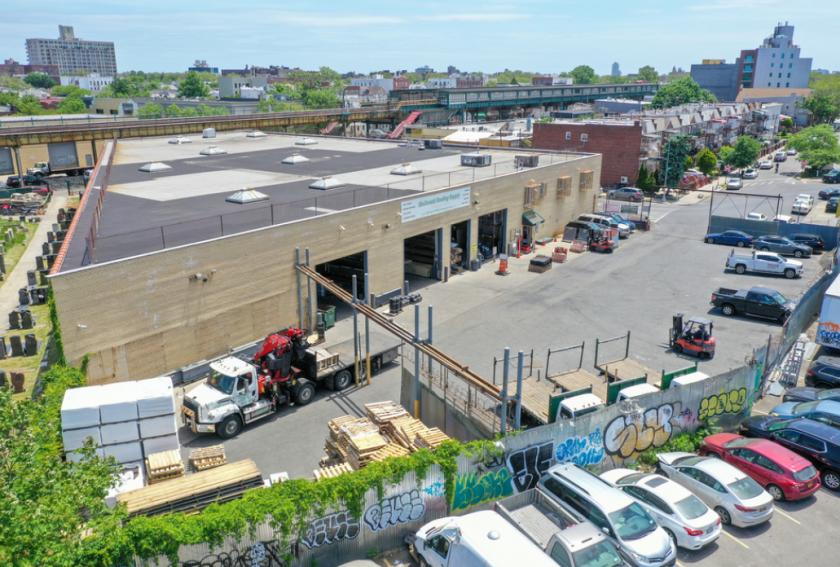
- • 9 loading docks 15 parking spaces
- • 172,000 buildable square feet please inquire
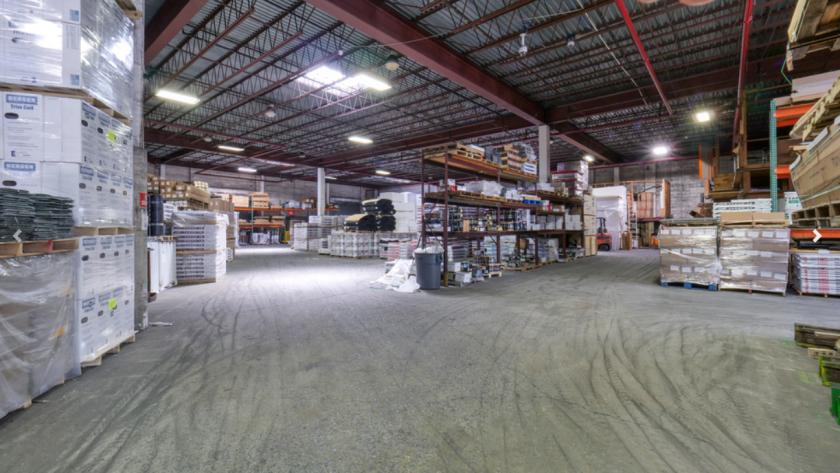
- • Fully Sprinklered with 22-foot-high ceilings
- • 2,000 SF of mezzanine office space
Additional Photos


Listing Agents

Jermaine Pugh
O: 646-933-2633
jpugh@b6realestate.com
O: 646-933-2633
jpugh@b6realestate.com
While we strive to provide the most accurate information, all listing information, and demographic data, is provided by third-parties. As such, MyEListing will not be responsible for the accuracy of the information. It is strongly recommended that you verify all information with the listing agent, and any relevant agencies, prior to making any decisions.


